BBC Question Time, factchecked
Join 74,000 newsletter subscribers who trust us to check the facts
Sign up to get weekly updates on politics, immigration, health and more.
Subscribe to weekly email newsletters from Full Fact for updates on politics, immigration, health and more. Our fact checks are free to read but not to produce, so you will also get occasional emails about fundraising and other ways you can help. You can unsubscribe at any time. For more information about how we use your data see our Privacy Policy.
“We can be a country where we don't need to have nurses going to food banks any more.”
Emily Thornberry MP, 11 May 2017
Media reports have found specific cases of practising or trainee nurses using food banks. But we’ve not found any research into how widespread this is.
The Royal College of Nursing (RCN) has reported “growing numbers of nursing staff using food banks, taking on additional jobs and accruing personal debt”. It told us that:
“We have a network of reps and RCN officers that stretches across the UK. They are in constant contact with members and this is what they report. This is not just one or two cases.”
We also spoke to the Trussell Trust, the largest food bank network in the UK, which told us that the people who use its services aren’t asked what job they have. So we don’t know how many nurses are being referred to it. But the Trust did say that it “had occasional reports from [its] foodbanks of nurses being referred for emergency food”.
According to a press release the RCN Foundation awarded over 500 financial hardship grants to working, retired, trainee, or unemployed nurses, midwives and healthcare assistants in the UK in 2016. The Foundation says that one in four grants went to a full-time nurse. They largely cover cost of living expenses, but from the press release it’s hard to say whether many were given to put food in people’s mouths.
RCN also says that 6,500 trainee nurses were awarded hardship grants from their universities over the last three years, although we haven’t been able to check these figures in detail.
“I just wanted to make the point about the railways, in terms of my understanding is that the railway companies, the private ones, receive four times as much funding as British Rail did in the 1970s and 80s.”
BBC Question Time audience member, 11 May 2017
This is the right order of magnitude. Figures we’ve seen indicate it’s now about three times what it was at the end of the 1980s, although these don’t include loans to Network Rail.
Britain’s privatised railways have been getting around £5 billion on average in government support over the last five years. In the last five years of the 1980s—the earliest period we have figures for before privatisation—it was an average of £1.6 billion in today’s money.
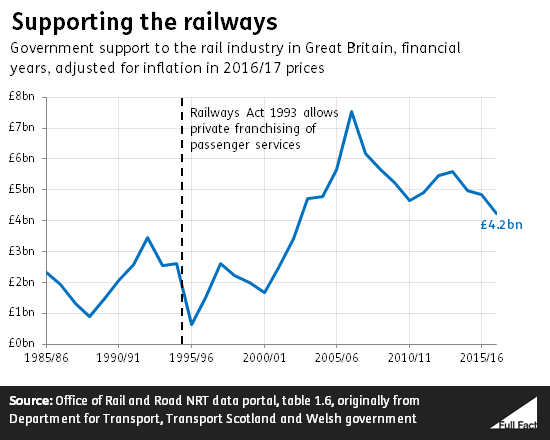
Government support for the rail industry isn’t the same thing as public spending on rail. In 2016/17 as much as £15 billion was spent on railways in total. Part of that seems to be down to how Network Rail—the government-owned manager of the railway—is funded. The government paid £5.7 billion worth of loans to Network Rail in 2016/17, which isn’t included in the government support figures.
Network Rail used to be considered a private sector company, but it’s now classed as public sector, and so now borrows money directly from the government.
The context of the discussion was about whether railways should be nationalised, as was suggested in the leaked draft of Labour’s manifesto. But we can’t draw too many conclusions about what effect privatisation has had on costs from these figures. For a start, we’d want to know what might have happened to government support if franchising had never happened. Going into detail on that is outside the scope of this factcheck.
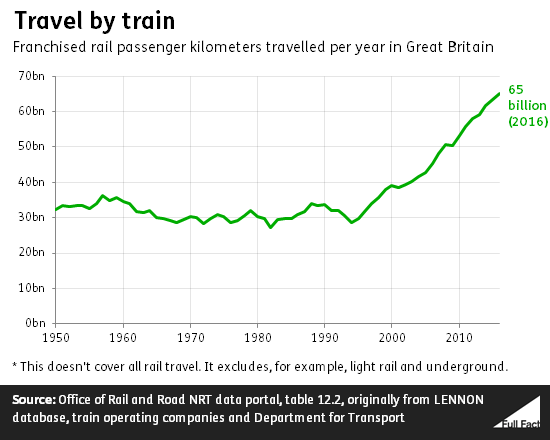
It’s still worth bearing in mind that we’ve never been using the railways more, and this clearly has an impact on the amount of funding the system needs to cope.
"After things like the NHS and pensions, the fifth biggest [government] expenditure, it's not education, it's not transport, it's not the police, it's debt interest on the national debt. It's £46 billion of money I can't spend or nor can anybody else spend on all those goodies that some people think are in the Labour manifesto. We have to live within our means."
Ben Wallace MP, 11 May 2017
That’s about how much the government spent on debt interest in 2015/16. Gross interest payments on central government debt came to about £45 billion and will have been a projected £48 billion for 2016/17, according to the Treasury.
The government effectively paid some of that to itself. Almost a quarter of government debt is owned by the Bank of England, which pays the profit back to the Treasury.
Ignoring interest payments to Bank of England, the government spent £33 billion in debt interest in 2015/16, with estimates of £36 billion and £42 billion for the following couple of years, according to the Office for Budget Responsibility.
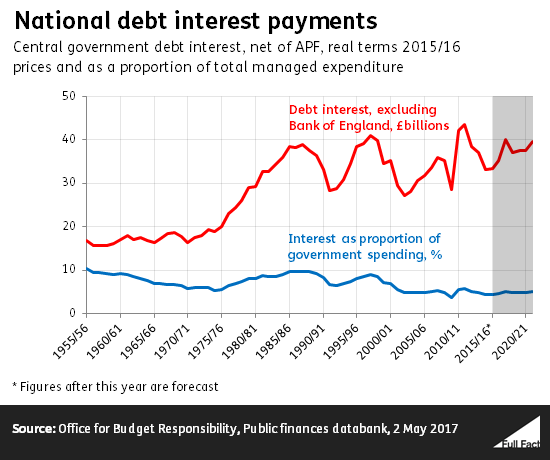
There are lots of ways to slice up government spending. One way is to divide it up according to the different functions of a government, using a method devised by the United Nations. From that angle, debt interest is indeed the fifth biggest item, after spending on health (£139 billion), benefits and tax credits (£125 billion), pensions (£110 billion), and education (£84 billion).
Here’s a breakdown we made earlier. It uses Treasury figures for 2015/16, when net debt interest was at a similar level to defence spending. But as they show, it’s not correct that we spend more on interest than on education—we spend over twice as much on that.
"So if you come from a wealthy family in Scotland, you are 3.5 times more likely to apply to university through the UCAS system than if you are a disadvantaged student….You are 2.5 times more likely to apply if you are wealthy in the UK, in England, than disadvantaged. In Scotland it is 3.5 times. So what we are seeing here is that the policy of free tuition has not had the desired result."
Merryn Somerset Webb, 11 May 2017
There are two ways to look at this that we’re aware of, both of which focus on 18 year olds. There are also some flaws with UCAS’ data on Scottish education, which means that comparisons with England should be done cautiously. We’ve written more about that here.
The claim is pretty much correct when it comes to how many students have been offered a university place from a particular group.
UCAS university entry rates for 18 year olds in the most advantaged areas in Scotland were 3.5 times that of young people in the most disadvantaged areas in 2016, while in England young people in the most advantaged areas were 2.4 times as likely to attend university.
The claim is incorrect when it comes to application rates—how many people apply to university from a particular group and what Ms Somerset Webb appears to be referring to in the claim. Ms Somerset Webb is getting back to us to confirm what evidence she was referring to.
The 2017 university application rate of 18 year olds living in the most advantaged areas in England was about 2.3 times that of students in the most disadvantaged areas.
In Scotland, students in the most advantaged areas were about 2.6 times as likely to apply to university in 2017 than those in the most disadvantaged areas.
Removing tuition fees in Scotland doesn’t seem to have “given Scotland any specific advantage...in relation to increasing overall levels of participation or participation by more disadvantaged groups”, says the Sutton Trust. It said increased competition for places, due to not having enough university places to meet demand, has had a particularly bad effect on students from the most deprived backgrounds.
This is specifically in relation to university access. A substantial number of disadvantaged students study higher education in colleges in Scotland, and aren’t reflected in these figures, which is one of the reasons why comparing university access in Scotland and England is tricky.
“It's worth remembering Glasgow was once the second city of the empire, now 40% of people live below the poverty line there.”
BBC Question Time audience member, 11 May 2017
We haven’t found the figures the audience member was referring to, but we have found similar figures on deprivation in Scotland.
Around 48% of areas in Glasgow were found to among the most deprived in the whole of Scotland in 2016. That’s more than any other council area in Scotland.
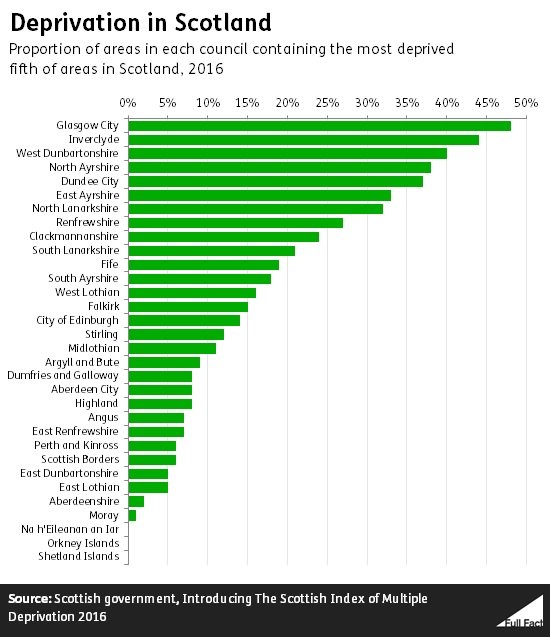
In this case, it’s telling us what proportion of areas falling within Glasgow City Council are part of the most deprived fifth of areas in Scotland.
That’s not the same as saying that 48% of people in Glasgow are living in deprivation. The Scottish government points out that people who are income deprived do not necessarily live in deprived areas. Likewise people who are not income deprived may live in a deprived area.
The Scottish government also says that “people who live in areas up to 40% most deprived may also experience difficulties.” Including these, 65% of areas in Glasgow were in the 40% most deprived in the country.
On the flipside, around 9% of areas in Glasgow were in the 20% least deprived in the country.
This is a different measure of poverty than Full Fact normally looks at which is based solely on household income.
“We have four million children who live below the poverty line.”
David Hayman, 11 May 2017
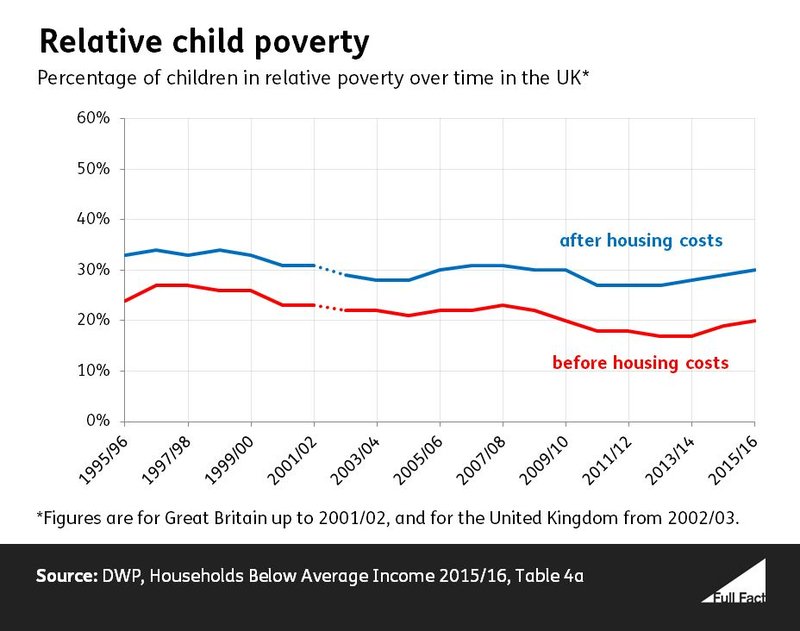
There were estimated to be around four million children in the UK living in relative poverty in 2015/16 once housing costs were taken into account. That’s around 30% of all children.
Relative poverty looks at households with less than 60% of the median income that year. There are other ways to measure poverty, though.
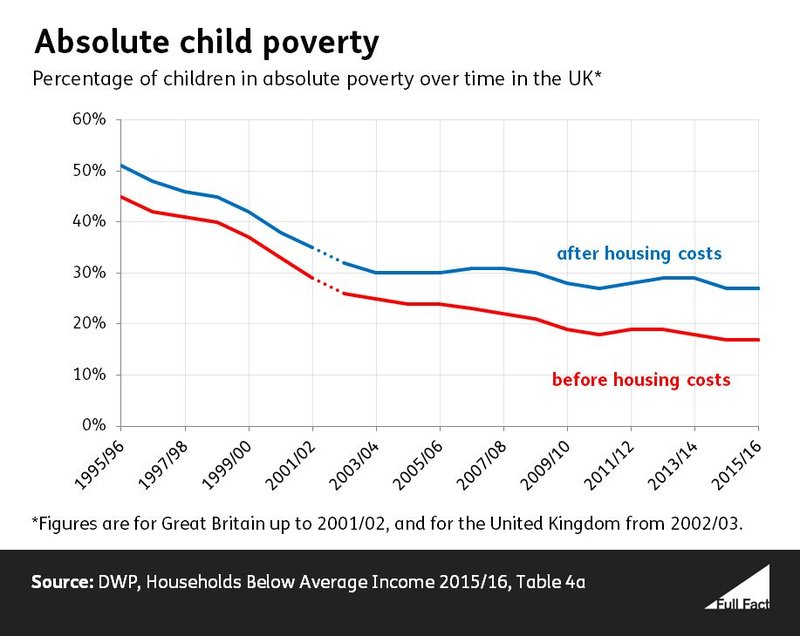
One is to look at households with 60% less than the median income in 2010/11, accounting for inflation. That’s known officially as ‘absolute poverty’.
Looking at it this way around 3.7 million children were living in poverty, or around 27%.
If we look at poverty before housing costs are considered, as government statisticians recommend, around 2.7 million children were in relative poverty in 2015/16, or around 20%. Around 2.3 million were in absolute poverty, or around 17%.