BBC Question Time, factchecked
Join 72,330 people who trust us to check the facts
Subscribe to get weekly updates on politics, immigration, health and more.
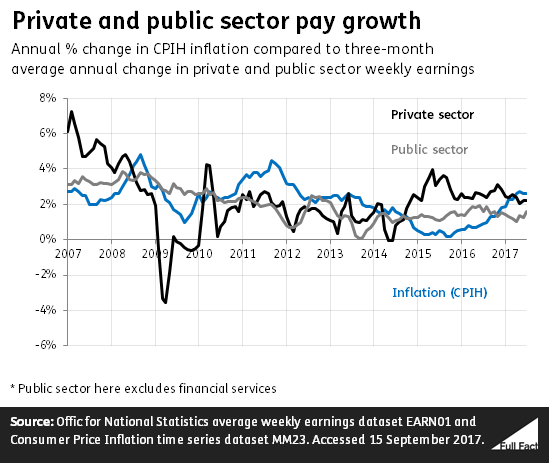
“As a result of the economic crash it was the private sector that got hit far more quickly and far harder and for far longer than the public sector.”
Julia Hartley-Brewer, 14 September 2017
During a conversation about wages on BBC Question Time on 14 September, Ms Hartley-Brewer made this comparison on the effect of the financial crash on the public and private sector.
Private sector wages did drop much more rapidly than public sector wages during the recession. They then began recovering as public sector wage growth slowed. In recent years the gap between the two has narrowed again.
Between 2008 and 2010 the private sector saw a real terms cut in wages, according to the Institute for Fiscal Studies (IFS). The IFS describes wages as “largely frozen” during this time as it was only increasing by around 1% in cash terms—inflation at the same time peaked at around 5%.
In contrast, public sector wages continued to grow at about the same rate as they had before the financial crisis and were much closer to the level of inflation. The IFS puts this in part down to the fact that many public sector wages are agreed in three year settlements. Many of these settlements lasted from 2008 to 2011, though that wasn’t the case for all public sector workers.
The IFS have looked at the changing gap between public and private sector wages, adjusting for the different types of workers in each sector. It found that after the recession public sector pay increased, compared to the private sector which fell sharply. But the IFS says that “the public sector pay restraint imposed since 2011 has returned the difference between public and private pay to around its pre-crisis level”.
“Across the economy, the fastest pay rises have been for people at the bottom end because we’ve brought in the National Living Wage, and that’s one of the reasons why income inequality has reduced in recent years, not gone up.”
David Gauke, 14 September 2017
It’s correct that lower-wage workers have generally seen the fastest wage rises in the last few years. The government’s introduction of the National Living Wage is part of the reason why, but there’s a lot more to inequality trends than changes in earnings alone.
Income inequality has fallen on some measures in recent years, although these trends are expected to reverse.
The National Living Wage has boosted earnings for some
The National Living Wage is the legally binding hourly rate for workers aged 25 and over. It came into force in 2016 and is currently set at £7.50 an hour. It’s different from the National Minimum Wage, which is lower and applies at different rates to people aged under 25.
This has contributed towards higher weekly earnings for people on lower incomes. Between 2013 and 2016, people on lower incomes saw much stronger earnings growth than people at the top, thanks to rises in the Minimum Wage and the introduction of the National Living Wage, according to the Office for Budget Responsibility.
Similarly, people on the Minimum and National Living Wage have seen stronger earnings growth after inflation than those with the middle and highest earnings earnings since about 2007. That’s according to the Institute for Fiscal Studies (IFS).
But this alone isn’t a magic bullet for reducing inequality
Mr Gauke goes on to connect the pay rises to reduced inequality, but there are two reasons we need to be cautious about this.
Firstly, the National Living Wage doesn’t benefit people at the very bottom as much as those in the middle. That’s because people at the lower end of the scale have more of their income made up by benefits. “The households gaining from the new [National Living Wage] are more evenly distributed across the income distribution, with the largest gains in the middle”, says the IFS.
Secondly, wage changes alone miss the bigger picture. Changes to taxes and benefits introduced by the government are set to affect people on the lowest incomes hardest, and this more than offsets the gains some workers get from increased pay as a result of the National Living Wage.
Inequality has been falling by some measures, but these trends are expected to reverse
No single measure can sum up what’s been happening to inequality in the UK in recent years. But we can get an idea by looking at a few examples.
Household incomes generally rose faster for those on lower incomes than those towards the top between 2007/08 and 2014/15. The IFS says this is because the recession in the late 2000s hit incomes hard, and households at the top were most affected by this as earnings make up a larger portion of their income. In addition, benefits tended to rise in real terms during this period so this benefited poorer households.
This trend is expected to reverse over the next few years—up to 2021/22—with lower-income households seeing smaller rises or even falls in their incomes after inflation. This is expected because of reductions to working-age benefits, along with expected rises in earnings—which again will tend to benefit higher income households.
“We’ve calculated that it will cost £4 billion in order to pay public sector workers an inflation increase.”
Dawn Butler MP, 14 September 2017
Pay rises for public sector employees have been capped at 1% per year since 2013, and was frozen for many workers in the two years before this. Labour claimed in its 2017 manifesto that lifting this cap would cost £4 billion in 2021/22, a claim repeated last night by Dawn Butler MP.
It’s correct that matching public sector pay to inflation over the next few years is estimated to cost £4 billion a year. However, Labour told us that its own position is to end the cap and return to collective bargaining or hand power back to the independent Pay Review Bodies.
Any claim about what a policy like this will cost in future years will be based on economic forecasts so is subject to a lot of uncertainty—here we don’t know how inflation, private sector pay or the number of people working in the public sector will change and affect these figures.
£4 billion a year to increase public sector pay with inflation
£4 billion a year is what the Institute for Fiscal Studies (IFS) estimates is the increased funding required to match public sector pay to inflation by 2019/20.
This is actually from its costing of the Liberal Democrats’ 2017 manifesto, rather than from what Labour was proposing.
Both Labour and the Liberal Democrats said they wanted to scrap the cap in their manifestos this year, but they proposed to do it in different ways.
The Liberal Democrat proposals involve matching public sector pay to the rate of inflation up to 2019-20, and from then matching pay rises to private sector increases. That’s £4.1 billion per year by 2019-20, rising to £5.3 billion by 2021/22, according to the IFS.
By contrast, Labour has suggested it would delegate decisions on public sector pay to independent Pay Review Bodies, a policy that the IFS assumed would lead to increasing public sector pay at the same rate as private sector pay from the start. They estimate that this would cost £6.3 billion per year by 2019/20 (rising to £9.2 billion by 2021/22).
There are no costings available for using collective bargaining to determine public sector pay, an alternative model that Labour said it could adopt.