What was claimed
New figures show the serious crime rate in England and Wales is rising.
Our verdict
New figures suggest recorded crimes are getting more severe, but they can’t prove that crime is rising.
New figures show the serious crime rate in England and Wales is rising.
New figures suggest recorded crimes are getting more severe, but they can’t prove that crime is rising.
“Revealed, the truth about UK crime: New official figures give more weight to worst offences... and show they're up by almost a fifth”
Daily Mail, 1 December 2016
“Serious crime rate trebles under new way of measuring”
The Times, 1 December 2016
“The most severe crimes up by 30 per cent in some areas”
Daily Telegraph, 1 December 2016
It’s official: killing someone is 2,700 times more serious than possessing cannabis.
At least, that’s the best estimate to come out of a new project designed to compare crimes in England and Wales by how severe they are.
The findings have made headlines, but we need to be cautious about how we interpret them. They show crimes recorded by the police are getting more severe, but they can’t prove that serious crimes are getting more common.
The fact that different publications describe the ‘rise’ in serious crime differently just reflects different ways they’ve chosen to present the same figures.
What’s all the fuss about?
Usually, when it comes to measurement, a crime is a crime. An offence of murder is one crime. An offence of possessing cannabis is one crime. They would have counted equally towards the 4.6 million offences recorded by the police in England and Wales last year. We could still find the breakdowns by type of crime to get a better picture, but the national ‘crime rate’ gets the headlines.
Now, there’s a new way of doing things.
Statisticians have come up with a way of ‘scoring’ different types of crime, according to their severity.
Homicide gets a score of 7,979 under this method. Attempted murder gets 4,663. Possessing cannabis, on the other end of the spectrum, gets a score of three.
Who decides how severe crimes are?
Sentencing data. The statisticians are trying to work out how harmful different kinds of crime are to society, and how they affect demands on the police. They decided on sentencing, ahead of other options, in part because:
“It can be argued that sentencing is an objective measure, reflecting how society views crimes differently, given that it is based on legislation set by Parliament on behalf of the public.”
It isn’t a perfect measure. Sentencing guidelines change over time, either because people view crime differently or to reflect changing government policies. Sentences also go beyond severity, for instance to reflect the offender’s criminal record.
What difference does this make?
Imagine the crime rate recorded by the police in 2002 was 100. By 2015, it would have been down to 69, on the same measure.
Now imagine that crime rate of 100, but tracked over time by severity. It would be down to 76 in 2015.
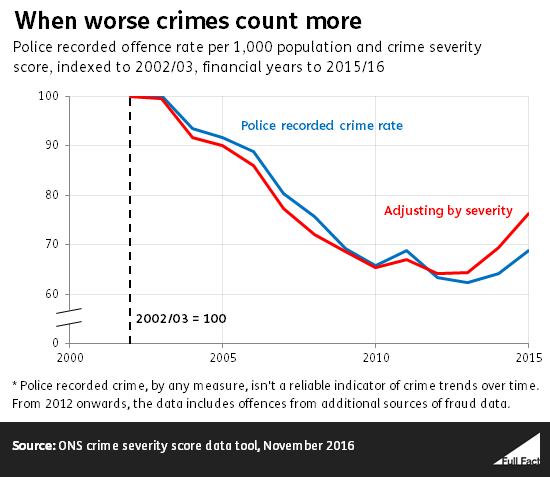
The two measures have diverged since about 2014. Since 2010, police recorded crimes are up 5%, but by severity they’re up 17%.
Why? The ONS says violent and sexual offences recorded by the police are rising, while less severe and more commonly recorded theft offences have been falling. When you take severity into account, the rises in these more serious offences look more pronounced.
Does this mean crime is now rising?
Recorded crimes are getting more severe. But we can’t conclude from recorded crime figures that crime is rising.
That’s because they suffer from two familiar problems.
First, they’re based on police records at a time when the police are known to be changing how they record crime. Police forces across the country have been improving their recording in response to criticism a few years ago, and this has meant they’re noticing more crimes. This is actually more of an issue for these new figures, because the police’s improvements have focused on violent and sexual crime.
Second, high-profile coverage of sexual offences, and historical offences, are thought to have made people more willing to come forward and report crimes to the police.
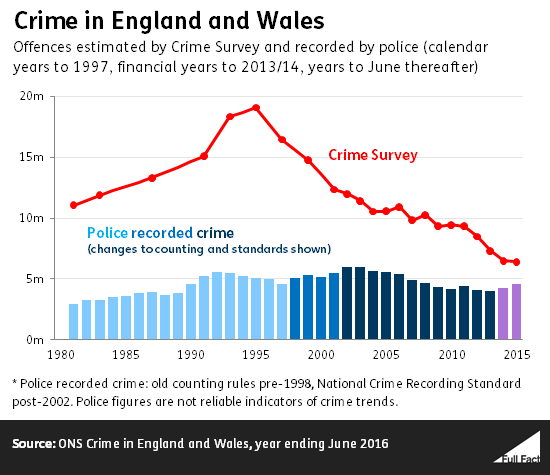
As an alternative to the police figures, we have the Crime Survey for England and Wales. That shows crime that is experienced and recounted by adults has been falling consistently since the mid-1990s. That said, there are new changes to this measure as well, and in future it will include more information on fraud and ‘cybercrime’.
 The ONS says that the crime score figures are intended mainly as a tool to help police forces and analysts understand the crimes happening in their local areas.
So why are different figures being reported?
That’s just different ways of reporting the same change, although still with all the strings attached to what the figures can actually tell us.
The Mail says serious crimes are up by a fifth. That’s a generous rounding of the 17% rise in crimes, weighted by severity, since 2010.
The Times says they’ve trebled. That’s comparing the 5% rise the usual police figures show, since 2010, to the 17% again.
The Telegraph is talking about Nottinghamshire when it talks of a 30% rise in the most severe crimes, comparing since 2012.
Full Fact fights for good, reliable information in the media, online, and in politics.
Bad information ruins lives. It promotes hate, damages people’s health, and hurts democracy. You deserve better.