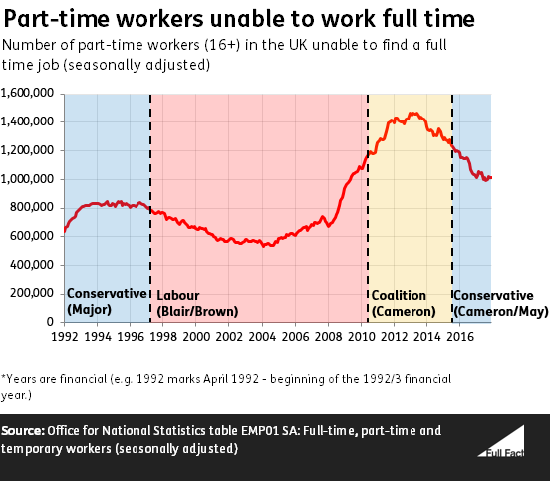
It’s correct that the average number of UK part-time workers aged 16 or over unable to find full-time work doubled from under the last Labour government to under recent Conservative-led governments.
The proportion of the economically active population who are part-time workers and unable to find full-time work has also increased—though by a bit less given that the UK population has also increased in that time. The proportion went from an average of 2.3% to 3.9%.
But overall the number of people currently who want more work but can’t find it is close to the lowest it has been in the past 25 years.
More part-time workers want more work, but fewer people are unemployed
From May 1997 to April 2010 the average number of part-time workers in the UK unable to find full-time work across the whole period was around 684,000, while in the time since May 2010 the average has been 1.3 million.
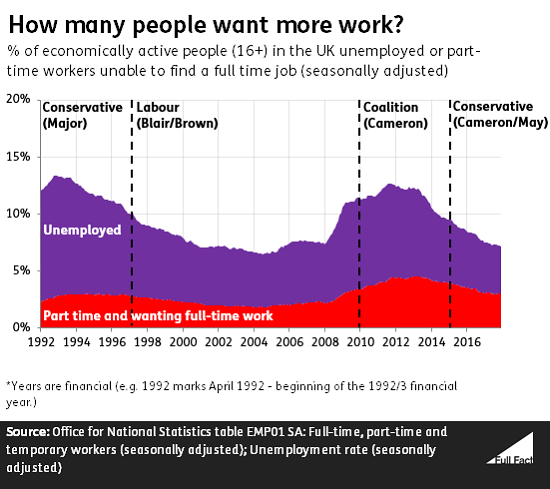
Following the recession in 2008-2009 both the unemployment rate and the rate of part-time workers wanting more work increased.
The unemployment rate (the number of people who are unemployed as a proportion of all employed people and those seeking and available to work) has since fallen to lows last seen in the mid-1970s, while the rate of part-time workers unable to find full-time work has fallen slightly but remains relatively high.
Combining the two figures for part-time workers who want more work and those who are unemployed allows us to see the proportion of economically active people (unemployed plus employed people) who want more work but can’t find it.
In the three months to April 2018, 7.2% of the economically active population wanted more work.
That’s the lowest rate since the three months to January 2006. The lowest rate since records began in 1992 was 6.5% in the last half of 2004.
It’s plausible that one of the reasons unemployment is low is because the number of part-time workers wanting more work is relatively high. But taking the two figures together, the number of economically active people wanting more work is not far off the lowest level seen in the last 25 years.
Fewer economically inactive people want work
The economically active population includes both people in work and unemployed people—those without a job who have actively sought work in the last four weeks and are available to start within the next two.
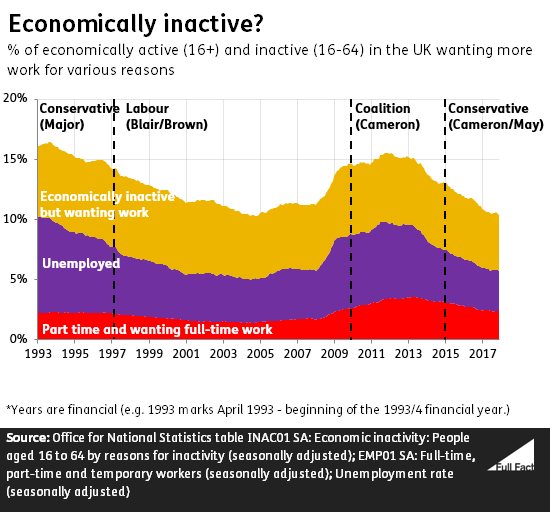
That means it excludes the “economically inactive” population which includes some people who want more work, but aren’t available to start soon or aren’t currently looking.
The ONS publishes data on this “economically inactive” population, if they’re aged between 16 and 64, and provides a figure on those who want a job.
By combining that data with the data for economically active people, we can see that the number of people who want more work is at the lowest level since 2005.
Looking at all people who are either in work or want to work, 10.4% want to work more hours. The lowest level since this data was first collected in 1993 was 10.3% in the three months to March 2005.