These figures aren’t quite correct. Around 4% of all people in this age group in the UK were employees and members of a union in 2015. That’s around 316,000 people. Meanwhile 13% of 25-34 year olds were employee members of a union that year, or 1.2 million people.
6.5 million people were employees and members of a trade union that year.
Ms Andrews meant to refer to the proportion of all union members who were in these age groups, according to the Institute for Economic Affairs, which Ms Andrews is news editor for.
5% of employee union members in the UK were between the age of 16 and 24 in 2015 and 18% were between the ages 25 and 34.
Comparing to employees rather than the whole population
A better measure might be to look at the proportion of employees who are in these age groups. 9% of all employees age 16 to 24 were union members that year and 20% of all employees were aged 25 to 34.
Trade union membership is highest among people over the age of 50, they accounted for 39% of all union members and 33% of all employees this age were union members in 2015.
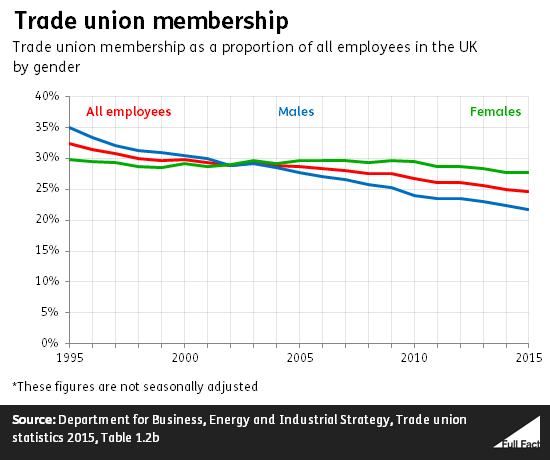
Overall, 25% of employees of any age were members of trade unions, or around 6.5 million people. This has been declining over the past 20 years, though the decline has been greater among men than women.
