Jeremy Corbyn's party conference speech, factchecked
Join 74,000 newsletter subscribers who trust us to check the facts
Sign up to get weekly updates on politics, immigration, health and more.
Subscribe to weekly email newsletters from Full Fact for updates on politics, immigration, health and more. Our fact checks are free to read but not to produce, so you will also get occasional emails about fundraising and other ways you can help. You can unsubscribe at any time. For more information about how we use your data see our Privacy Policy.
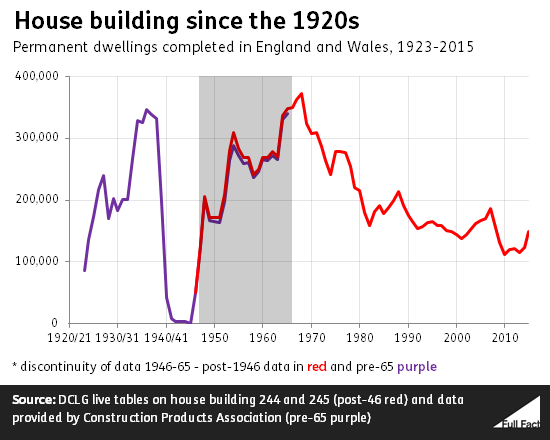
“...house building has fallen to its lowest level since the 1920s...”
Jeremy Corbyn, 28 September 2016
Mr Corbyn is correct that house building has been at a record low in recent years. England and Wales have seen the fewest new homes completed per year during peacetime since the 1920s, according to official statistics.
2010 saw the lowest level, with 112,000 homes being built across England and Wales. In 2015 this increased to 149,000.
But the number of new homes has been falling since the 1960s. Before 2010, the period with the second lowest level of house building was seen under Labour in the early 2000s.
Update 29 September 2016
We updated this piece to make it clearer when the lowest levels of house building were.
“...council homes are sold off without being replaced...”
Jeremy Corbyn, 28 September 2016
We recently looked into this and found that roughly one in six council homes which are sold off under Right to Buy are replaced—a replacement being a home built or bought using some of the money from the sales generated by recent government policies.
But does this mean that there are fewer council houses available?
The vast majority of council houses are available at a level of rent known as social rent, which is around half the normal market rent which would be charged on property.
The number of council properties available for social rent in England has been falling in the last few years. In 2014/15, there were 1,635,000. That’s 28,000 less than in 2013/14 when there were 1,663,000 available.
That's not the whole story. Councils nowadays own a much smaller proportion of the country's social rented housing stock compared to what they once did. Housing associations are the biggest provider of houses for social rent. So to understand the complete picture these need to be considered too.
In 2014/15 there were about 2,159,000 units available from housing associations at ‘target rents’ which, according to the Homes and Communities Agency, are roughly equivalent to social rent. The following year there were 2,123,000, a decrease of nearly 37,000.
This follows the trend of the last five years, where there has generally been a decrease in the number of housing association properties available at target rents.
Including “affordable” rents, as the government does in its definition of social housing, the stock of social and affordable rented homes continues to increase. Affordable rents are up to 80% of market levels, while social rents are around 50%.
Update 20 December 2016
We removed “although more social housing generally is being built than is being sold” from the conclusion and replaced it with a more detailed picture of what’s been happening to levels of “social rented” and “affordable rented” housing. We also updated the piece to include these breakdowns in the text, and to use a better measure of the total stock of social housing.
“...there’s been an explosion of temporary, insecure jobs, nearly one million people on zero hour contracts.”
Jeremy Corbyn, 28 September 2016
About 903,000 people reported that they were employed on a zero hours contract in April-June 2016—3% of people in employment. This is a rise on the estimate of 747,000 for the same time last year.
We don’t know how much of the rise over time is genuine. Increases in the numbers are likely to include at least some people who were already on the contracts but only recently became aware of this, possibly due to increased media coverage of the issue.
The only reliable data that we can use to compare over time, from surveys of businesses in 2014 and 2015, suggests there was little change in the number of contracts overall during that period.
There were 1.7 million people in temporary jobs in May to July 2016—about 6.2% of all those in work. This is about the same level it was early 2010, though it did rise to 6.6% in 2012. The highest level ever recorded was almost 8% in 1997.
In terms of whether people in these jobs would rather be working more hours, 31% of people on zero hours contracts say they want more hours, mostly in their current job. 32% of the 1.7 million people in temporary jobs say they are doing so because they can’t find a permanent job.
“There are now six million working people earning less than the living wage...”
Jeremy Corbyn, 28 September 2016
Six million jobs were paid less than the living wage in 2015. This isn’t the same as six million people, as some people have more than one job. Last year it was estimated that at least 5.4 million people were paid less than the living wage in 2014.
The living wage used at the time of the survey was £9.15 in London, and £7.85 in the rest of the UK, as calculated by the Greater London Authority and Loughborough University. These aren’t the same as the government’s new “National Living Wage”, which is lower, in place from April this year.
These are employment jobs, so don’t count the self-employed or people on a reduced rate, such as apprentices.
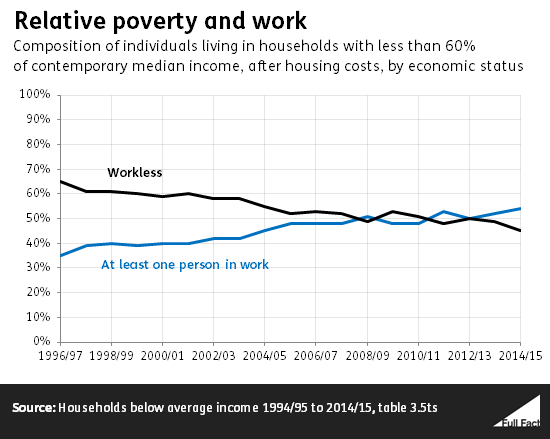
"...and poverty among those in work is at record levels."
There’s no single, preferred measure of poverty in the UK.
"Relative poverty"
Relative poverty is how we describe households who earn less than 60% of what the median household earns. The median household is the household in the middle when you line up households based on what they earn.
"Absolute poverty"
Absolute poverty is almost the same but households are compared to what the median household earned in 2010/11.
Around 50% of people thought to be living in relative poverty, before housing costs, had at least one member of their family in work. That’s the highest level since records began in 1997. Taking into account housing costs, this rises to 54%, also the highest level recorded.
The proportions for absolute poverty are also at record highs.
The proportion of people who are living in poverty and in working families was increasing from the late 1990s to the early 2000s, but the trend then started to level out.
“People are fed up with a so-called free market system, that has produced grotesque inequality...”
Jeremy Corbyn, 28 September 2016
The Labour leader mentioned in particular “income and wealth” inequality. It’s up to you what you count as grotesque, but to take earners at opposite ends of the income scale, on the minimum wage you’d earn £5.30 an hour as a 18-20 year old. Whereas the average FTSE 100 Chief Executive now reportedly earns £5.5 million a year.
Figures quoted by the Office for National Statistics suggest the richest 10% get almost 30% of gross income in the UK.
There are a lot of different ways to measure inequality. Overall, income inequality actually seems to have decreased slightly in recent years.
“Since 2007/08, there has been a slight decrease in overall income inequality on a range of measures, though from a longer-term perspective remains above levels seen in the early 1980s”, according to the ONS.
The Institute for Fiscal Studies commented recently that “The combination of strong employment growth, some earnings growth for low-paid workers, and a lack of earnings growth for others, has kept inequality below its pre-recession level”.
But it also said that a slight fall in inequality for most people has been offset by the share of income going to the top 1% continuing to increase, at least up until the recession.
Wealth inequality is a lot harder to measure. We’ve written more about it here.
Income and wealth aren’t the whole argument. Mr Corbyn stated that “Labour’s goal isn’t just greater equality of wealth and income but also of power”.