Who's waiting? NHS waiting times depend on who you're looking at
"The Prime Minister appeared to suggest that the number of people waiting longer than 18 weeks for an operation had gone down since his reorganisation. I have the figures here. In April 2010, 20,662 people waited longer than 18 weeks. In April 2014, the figure was 29,417. The number has gone up. Do you not think, Mr Speaker, that the Prime Minister might correct the record before he leaves the Chamber?" — Andy Burnham
"The numbers waiting longer than 18, 26 and 52 weeks to start treatment are lower than they were at any time under the last Government. Those are the facts. The Opposition were caught out with dodgy statistics yesterday, and I think that they have just done it again." — David Cameron
In a point of order following today's Prime Minister's Questions, Andy Burnham and David Cameron seemed to disagree about what the figures show on NHS waiting times.
So who's right?
It depends on whether we're talking about those patients who began treatment in April, or about those who were still waiting at the end of that month. We've chosen to focus on the 18 week part of the Prime Minister's claim.
Join 74,000 newsletter subscribers who trust us to check the facts
Sign up to get weekly updates on politics, immigration, health and more.
Subscribe to weekly email newsletters from Full Fact for updates on politics, immigration, health and more. Our fact checks are free to read but not to produce, so you will also get occasional emails about fundraising and other ways you can help. You can unsubscribe at any time. For more information about how we use your data see our Privacy Policy.
Of patients beginning treatment involving admission to hospital in April 2014, a greater number had been waiting for over 18 weeks than at the same point in 2010. This is the group Andy Burnham was referring to.
But of those still on the waiting list for treatment at the end of April — including people who won't be admitted to hospital - fewer had been waiting for over 18 weeks in 2014 than in 2010. This is the group the Prime Minister was referring to.
The two trends are consistent - as greater numbers of those who've been waiting over 18 weeks are treated, fewer will remain on the waiting list.
In April more of the patients who began 'admitted' treatment had waited over 18 weeks
In April 2014, 295,489 people began treatment which involved being admitted to hospital after being referred by their GP. Of these, 90% had been waiting for 18 weeks or less. That left 29,417 patients who'd been waiting for longer.
In April 2010, the equivalent figure was 22,774. Mr Burnham's figure of 20,662 actually applies to the month after, May 2010. This level of variation month-on-month isn't unusual — there are always seasonal fluctuations on the number of waiting patients, meaning that the most useful comparison is from April 2010 to April 2014.
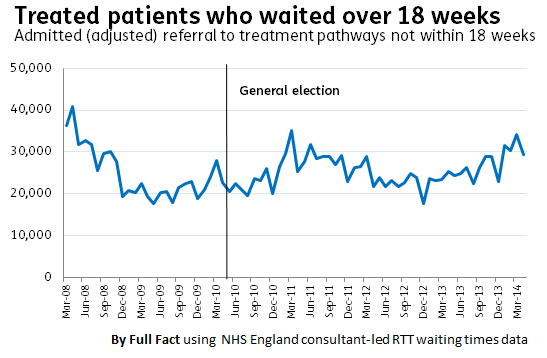
Our graph will be slightly less accurate than the figures used by Mr Burnham as it uses published time series data which uses the total number of patients, and for some of these the time they had been waiting was not recorded. In April 2014 there were 485 such patients, about 0.2% of the total.
But there were fewer patients still waiting who had waited 18 weeks or more
The same time series data also contains information on how long those who were still waiting at the end of each month had been waiting at that point. These are people who are still in the queue for treatment.
At the end of April 2010, of the 2.5 million patients on the waiting list, 218,000 had been waiting for over 18 weeks. In April 2014, of around 3 million in the queue the number was 187,000.
The current number is lower than at any point between August 2007 — when the data was first published — and April 2010.
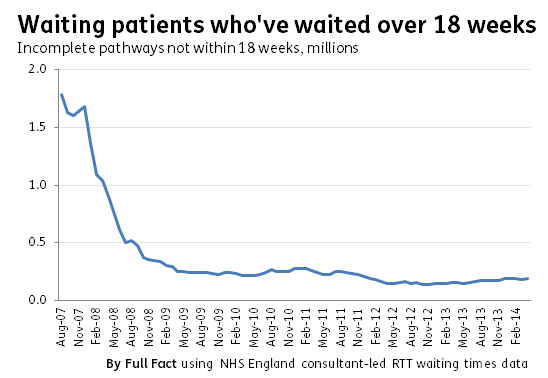
The same caveat applies to these figures, and graph, as to the first graph; they don't take into account the patients for whom waiting times are not known.
We've corrected the source given at the foot of the graphs to make clear the data comes from NHS England. Originally they incorrectly attributed the data to the HSCIC.