Prime Minister's Questions, factchecked
Join 73,000 newsletter subscribers who trust us to check the facts
Sign up to get weekly updates on politics, immigration, health and more.
Subscribe to weekly email newsletters from Full Fact for updates on politics, immigration, health and more. Our fact checks are free to read but not to produce, so you will also get occasional emails about fundraising and other ways you can help. You can unsubscribe at any time. For more information about how we use your data see our Privacy Policy.
“Yet she can’t explain why people’s wages are lower today than they were ten years ago...”
Jeremy Corbyn, 19 April 2017
The official headline measure of median weekly wages for full time workers is lower now than ten years ago.
Although the average worker is earning more money... it will buy them less. Wages have risen each year but prices have risen faster.
When prices rise it’s called inflation. If you adjust wages for price inflation then you can see their ‘real’ value.
The real value of the median weekly wage for full time employees fell every year between 2008 and 2014.
It has grown again since 2014, although more recent published data suggests that the pace might have slowed over the past year.
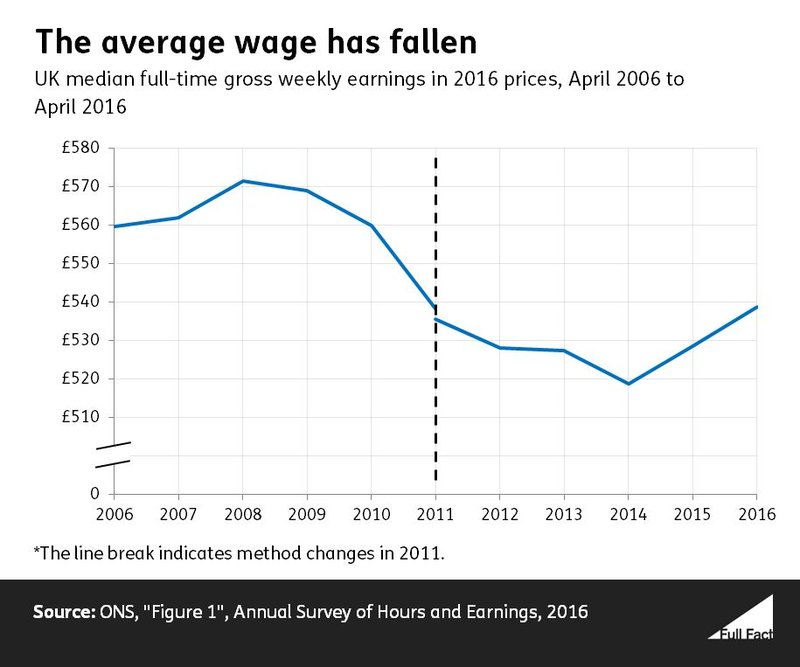
The median wage is the wage of the middle-earning person. Among other things, focusing on median rather than mean average wage means that the picture isn’t disproportionately affected by top earners.
More recent data is available for mean average wages. Broadly, the picture is much the same.
But it’s still the national average across the UK as a whole. It might not match the view from specific regions, industries or age groups (for example) as the chief economist at the Bank of England discussed last June.
In theory, average wages could fall without any one person getting a pay cut, because new entrants might be getting less than before while older higher earners continue to retire. So these figures don't necessarily show what's happened to most people individually, but they do give a sense of what's happened overall.
“...six million people earning less than the living wage...”
Jeremy Corbyn, 19 April 2017
6.2 million jobs paid less than the Living Wage Foundation’s living wage in 2016, according to the Office for National Statistics.
That’s not quite the same as six million people because some people have more than one job.
Mr. Corbyn made the same claim in January, when we found that a separate set of estimates suggest around 5.4 million people with one job earned below the Foundation’s living wage in 2014.
The Living Wage Foundation’s voluntary living wage is currently set at £9.75 in London and £8.45 across the rest of the UK.
The charity, which focuses on the cost of living, base their calculation on an assessment of living costs. It shouldn’t be confused with the government’s new National Living Wage, which is effectively a new minimum wage for people aged 25 and over.
6.2 million jobs is about 23% of jobs in the UK.
“Child poverty is up and pensioner poverty is up.”
Jeremy Corbyn, 19 April 2017
There are several ways to measure poverty. Mr Corbyn’s office told us he was referring to the number of pensioners and children in relative poverty since 2010, both after housing costs are included. By these measures child and pensioner poverty have increased slightly since 2010/11, but looking at other measures they have remained flat or even fallen.
Relative poverty looks at households with less than 60% of the current median income.
Another way to measure poverty is by looking at households with 60% less than the median income in 2010/11. That’s known as absolute poverty.
The proportion of children and pensioners in absolute poverty has been decreasing over the last two decades, though it has remained relatively stable in the last decade.
Child poverty
In 2015/16 an estimated 4 million children in the UK were living in households in relative poverty, taking account of housing costs. In 2010/11, the year the Coalition government took office, it was at 27%—in 2015/16 it was at 30%.
The proportion of children in absolute poverty (again, after housing costs) appears to have returned to the level it was at in 2010/11 (27%).
If we look at poverty before housing costs are considered, as the DWP recommends, similar trends seem to be present. 18% of children were in relative poverty in 2010/11 and 20% in 2015/16, or around 2.7 million. The proportion of children in absolute poverty went from 18% to 17%.
We’ve asked the Department for Work and Pensions whether any of these changes are significant enough to be sure that a real change in the numbers is happening, or if they could be caused by uncertainties in the data.
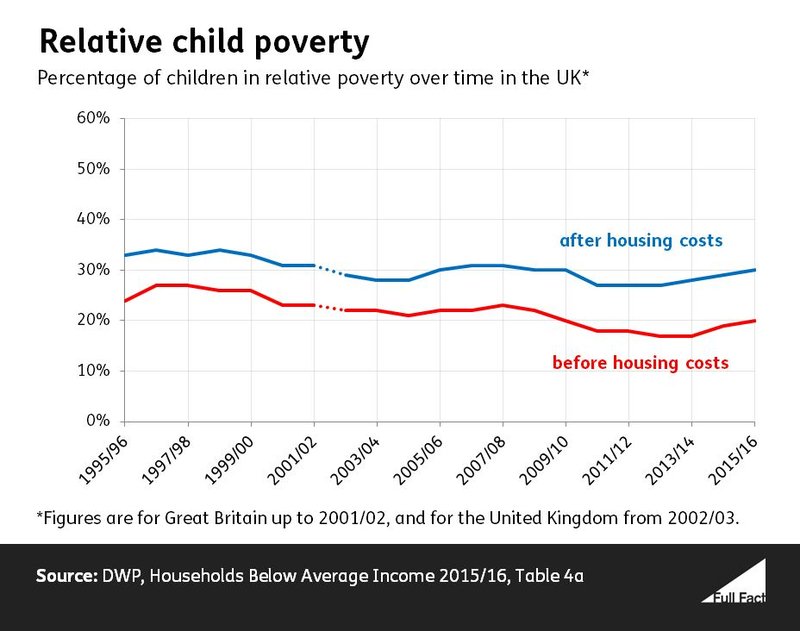
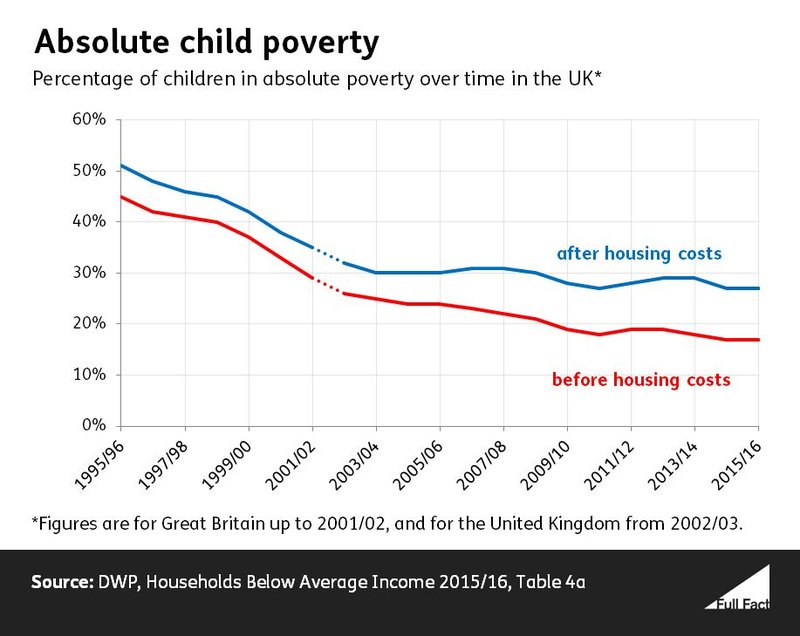
The percentage of children in absolute poverty has fallen over the last 20 years, while the proportion of children in relative poverty has decreased, but to a lesser extent.
Children are much more likely to be in poverty than any other group, whatever measure you look at.
Pensioner poverty
The percentage of pensioners in relative poverty after housing costs increased from 14% to 16% between 2010/11 and 2015/16. That’s around 300,000 people.
Again we’ve asked the DWP if this change is significant.
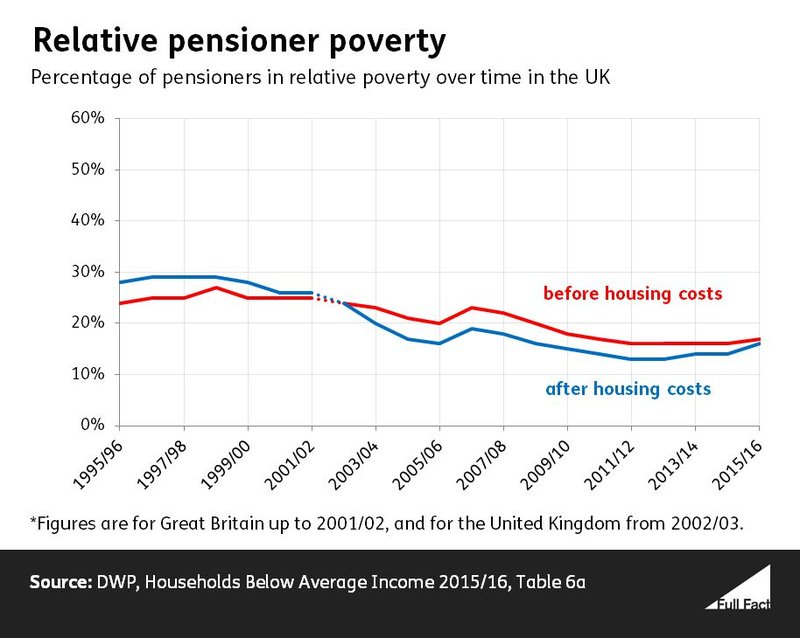
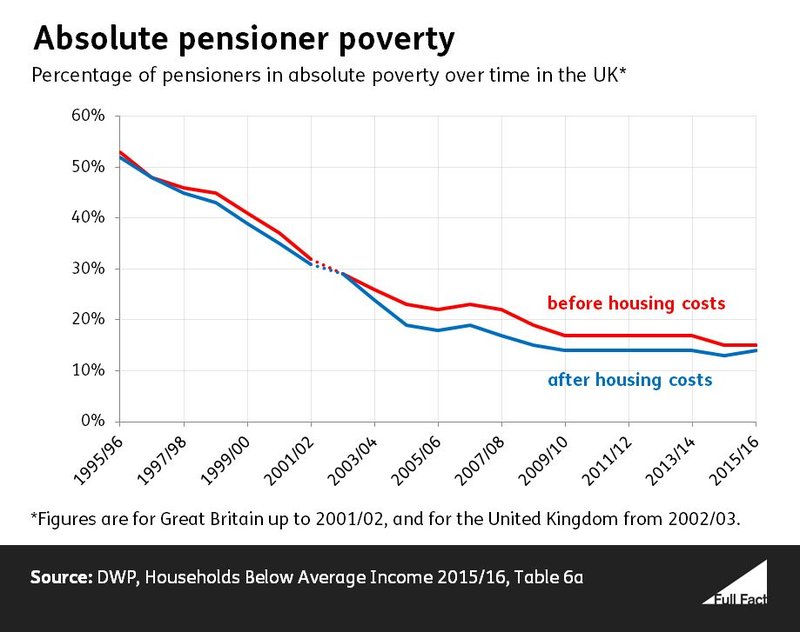
The after housing costs measure is used because so many pensioners own their homes mortgage-free.
Over the last 20 years the percentage of pensioners in absolute poverty has been falling, though the trend has flattened out over the last decade.
“I will be taking out to the country in this campaign a proud record of a Conservative government: … an economy with the deficit nearly two thirds down.”
Theresa May, 19 April 2017
“In 2010 they promised to eradicate the deficit by 2015. In 2015 they promised to eradicate the deficit by 2020.”
Jeremy Corbyn, 19 April 2017
This is correct, looking at the deficit as a proportion of GDP, and is a claim the government has made before.
Public sector net borrowing went from 9.9% of UK GDP to 3.8% between 2009/10 and 2015/16. That’s a decrease of just under two thirds. This year it is forecast to be 2.6%.
‘Public sector net borrowing’ is the headline measure of the government’s budget deficit. It’s the difference between the government’s income (mainly taxes) and everything it spends on public services, investment, and debt interest.
Borrowing as a proportion of GDP decreased because the amount the government borrowed over this time fell from £166 billion to £72 billion (in 2015/16 prices). At the same time the UK’s GDP also increased.
Unmet targets
But the deficit didn’t fall as far as planned, as Mr Corbyn pointed out.
Mr Corbyn’s underlying point is correct: the government set deficit targets in 2010 (which it didn’t meet) and in 2015 (which it abandoned).
But when the government said it would balance the deficit by 2015 and create a budget surplus by 2020 it wasn’t referring to the same measure each time.
In 2010 the government promised to eliminate the “cyclically-adjusted current balance” by 2015/16.
This measure of the deficit ignores investment spending. It’s also adjusted to take into account whether the economy is in a ‘boom’ or ‘bust’ period.
The government is now forecast to achieve that in 2018/19, three years later than the original target.
In 2015 the government updated its plans and aimed to have a surplus on public sector net borrowing by 2019/20. This is the wider headline measure we discussed above, which unlike the 2010 measure includes investment spending and isn’t cyclically-adjusted. This means that the government would have to reduce spending by more than under the previous target.
The government isn’t forecast to achieve this within the next five years, and new targets were set by the Chancellor last autumn.
“A tax cut for 30 million people, with four million people taken out of income tax altogether.”
Theresa May, 19 April 2017
About four million fewer people have to pay income tax now than did in 2010/11, according to government estimates.
You can earn up to a certain amount before you have to pay income tax in the UK. This income is known as your personal allowance.
Under the Coalition government the personal allowance went up from £6,475 to £10,600. In total, these changes meant that 4 million people in the UK no longer had to pay income tax and 28 million people saw their tax bill reduced, according to the Treasury.
In 2015 the Conservative government increased the personal allowance again, which was to increase from £10,600 to £11,000 in 2016/17.
On 6th April 2017 the personal allowance went up to £11,500. Together these increases are expected to take another 1.3 million people out of paying any income tax, and to cut income tax for 31 million people in 2017/18.
“£1,250 more a year for pensioners. That’s a record we can be proud of.”
Theresa May , 19 April 2017
The government has increased the cash given to pensioners eligible for the full basic state pension. But once inflation is taken into account, the increase is less than half of what the Prime Minister suggests, and is only for pensioners receiving the full amount of the basic state pension.
How much will pensioners be getting once we take account of inflation?
The Department for Work and Pensions told us that the Prime Minister was referring to changes in the amount paid to pensioners who receive the full basic state pension.
The basic state pension is a payment from the government that you receive if you reached state pension age before 6 April 2016 and you paid National Insurance contributions during your working life. In 2017/18, the basic state pension is £122.30 per week.
In 2010/11 pensioners eligible for the full basic state pension were paid £97.65 per week. This is £24.65 less per week than in 2017/18. Per year, this is £1,281.80 more in cash.
But what about inflation? Simply put, things cost more in 2017 than they did in 2010. What does this mean for changes in the state pension?
If that £97.65 state pension in 2010/11 had just risen in line with inflation, it would only be worth £111.55 now. So it’s actually £10.75 more per week, or £558.62 a year, from the government once we account for inflation.
Not all pensioners are eligible for the full basic state pension
To get the highest possible amount from the basic state pension you must have paid National Insurance or received National Insurance Credits for 30 years. This means that not all pensioners eligible for the basic state pension will get the increase mentioned by the Prime Minister.
The changes the Prime Minister was referring to don’t cover the new state pension. If you reach state pension age on or after 6 April 2016 you’ll receive this form of pension instead, for which the highest possible payment is £159.55 per week.
This amount is higher because the new state pension isn’t topped up with the additional State Pension like the old one is. Instead you receive one payment based solely on your National Insurance contributions.