Prime Minister's Questions, factchecked
Join 73,000 newsletter subscribers who trust us to check the facts
Sign up to get weekly updates on politics, immigration, health and more.
Subscribe to weekly email newsletters from Full Fact for updates on politics, immigration, health and more. Our fact checks are free to read but not to produce, so you will also get occasional emails about fundraising and other ways you can help. You can unsubscribe at any time. For more information about how we use your data see our Privacy Policy.
“We have a crisis in school places and class sizes soaring thanks to [Theresa May’s] government.”
Jeremy Corbyn, 8 March 2017
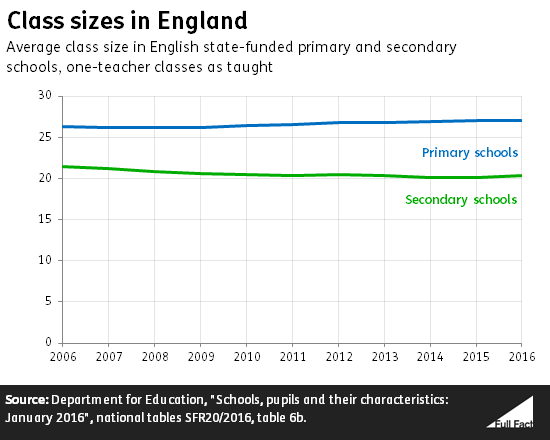
There's an extra 0.7 pupils—not a unit of measurement known to teachers—in the average primary school class since 2010. That’s according to official statistics, covering state-funded primaries in England only.
But in secondary schools, the average class size has inched down since 2010, and has dropped noticeably over the course of the decade.
The average primary class had 26.4 pupils in 2010, and 27.1 in 2016. Primary school pupil numbers have risen over the period, by over 430,000, with the number of classes not keeping up. This has meant more pupils are in classes of between 31 and 35 pupils.
There’s a legal limit on the size of infant classes, which are for the very youngest pupils: 30 pupils to one teacher, with some exceptions. Despite this, the number of children in an infant class larger than 30 has tripled since 2010, although it did fall between 2015 and 2016.
For secondaries, which have had to accommodate fewer pupils in total since 2010, the average classroom contained 20.5 pupils in 2010 and 20.4 in 2016.
These figures are an all-England average for a particular day in January of each year; individual schools and teachers will have different experiences.
“The National Audit Office tell us that a very large number of new school places are needed—420,000… At the same time, per pupil spending is falling in real terms.”
Jeremy Corbyn, 8 March 2017
“The majority of free schools that have been opened, have been opened in areas where there’s a need for school places. And the majority have been opened, actually, in areas of disadvantage—where they are helping the very children we want to see getting the opportunity to get on in life.”
Theresa May, 8 March 2017
Rising pupil numbers will mean that 420,000 new school places are needed in primary and secondary schools across England between 2016 and 2021, according the National Audit Office.
Around 232,000 will be in primary schools and 189,000 in secondary schools.
There were almost 600,000 new school places created between 2010 and 2015. Around 20% of these came from free schools. That rises to 43% if you just look at new secondary school places.
It’s also correct that the majority of free schools have been opened in areas where there is a need for it. 83% of new free schools approved since 2013 were in areas where there was a local need for places.
The National Audit Office also says that “the Department [for Education] estimates that 56,000 of the 113,500 new places in mainstream free schools opening between 2015 and 2021 will contribute to meeting local demographic need for new places”.
We’ve asked the Department for Education what the Prime Minister was referring to when she said that the majority of free schools had been opened in disadvantaged areas.
In September last year the government said that 48% of the 344 free schools which had been opened up until that point were in the most deprived 30% of areas in England.
Overall spending on mainstream schools, including free schools, is set to increase from £35 billion in 2015/16 to £38 billion in 2019/20. At the same time, spending per pupil is expected to decrease by 6.5% according to the Institute for Fiscal Studies, taking account of inflation. This rises to 8% when comparing 2014/15 to 2019/20 and taking account of increasing costs of things like staff pension schemes, according to the National Audit Office.
“...the Labour party has more women MPs than all other parties combined in this house, and a shadow cabinet of which half the members are women.”
Jeremy Corbyn, 8 March 2017
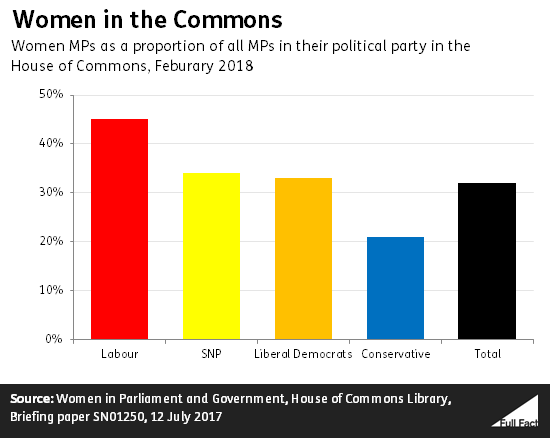
Labour has 119 women MPs, which is more than every other party combined. The Conservatives have 67, the SNP 12, and there are ten more among smaller parties and independents. That adds up to 208 women sitting in the Commons, 32% of all MPs. A record number of women were elected in 2017.
Labour also has a higher proportion of women MPs than the other large parties. 45% of Labour MPs are women, 21% of Conservative MPs, and 34% of SNP MPs.
Half of the shadow cabinet members are women. There are 32 members and 16 women. In the government 26% of cabinet members are women, six of 23 posts. Not all members of the cabinet and shadow cabinet are MPs—a few are members of the House of Lords.
If we look at the ‘Great Offices of State’ (the Prime Minister, Chancellor, Home Secretary and Foreign Secretary) the gender split is 50:50 for both cabinet and shadow cabinet.
“When it comes to female Prime Ministers it’s 2-0 to the Conservatives.”
Victoria Atkins MP, 8 March 2017
Besides Theresa May the UK has had only one other female Prime Minister. Margaret Thatcher served from 1979 to 1990 and was also a Conservative MP.
“We have the highest female employment rate on record, we have the highest percentage of women on FTSE 100 boards on record, the gender pay gap is at the lowest on record... there’s still much more to do...”
Amanda Milling MP, 8 March 2017
It’s true that we have the highest female employment rate on record. A higher proportion of women aged 16-64 are in paid work than ever before and the same is true if you count everyone up to state pension age.
There’s still a nine percentage point gap between the employment rate for men and women aged 16-64.
We also have very near to the highest ever percentage of women on FTSE 100 boards, according to the professional forum Boards Watch.
The FTSE 100 includes the hundred most highly-valued companies listed on the London Stock Exchange.
About 27% of directors on their boards are women: 32% of non-executive directors and 10% of executive directors. The proportion seems to have fallen fractionally in the months leading up to March 2017, although that’s nothing compared to the large year-on-year increases that came previously.
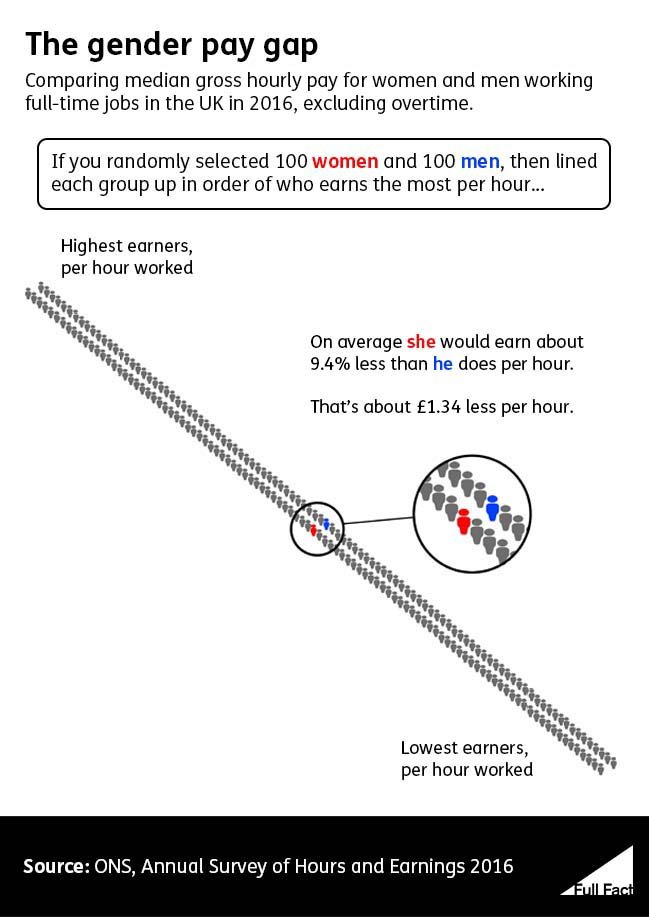
Finally, it’s true that the gender pay gap is the lowest on record by median hourly earnings. That’s correct whether you compare hourly earnings across all workers, or just look at full time workers.
There’s still a gap. If you knew nothing about two people except that one was a man, one was a woman, and both were working full-time, then you’d expect the woman to earn about £1.34 per hour less than the man.
Your expectations would change if you knew a bit more about them. The gender pay gap varies according to things like age, how much you get paid, the hours you work and the type of job you do.
We’ve discussed what these kinds of statistics do and don’t tell us in our article on age, motherhood and the gender pay gap.