BBC Question Time, factchecked
Join 73,000 newsletter subscribers who trust us to check the facts
Sign up to get weekly updates on politics, immigration, health and more.
Subscribe to weekly email newsletters from Full Fact for updates on politics, immigration, health and more. Our fact checks are free to read but not to produce, so you will also get occasional emails about fundraising and other ways you can help. You can unsubscribe at any time. For more information about how we use your data see our Privacy Policy.
“In January there were a million people who were lying on hospital beds who couldn’t leave because they had nowhere else to go.”
Paul Nuttall MEP, 4 May 2017
This seems to be incorrect, but we’ve asked UKIP to confirm Mr Nuttall’s source.
There were just over 7,100 people waiting to be discharged from hospitals in England when they were medically fit to leave on the last Thursday of January this year, according to official figures.
Across the whole month there were 197,000 “delayed days” or full days when a patient was still in hospital despite being fit to be discharged.
These delays can be for a wide variety of reasons. Patients can be waiting for an assessment or for some other kind of NHS treatment, they might be waiting for a place in a nursing home to become available or for a community care package to be set up. It may even be the choice of the patient or their family that they remain in hospital.
Across the whole of 2016 there were over 2 million delayed days and 75,000 patients waiting to be discharged at the end of each month. The BBC reported recently that one million of these delayed days between April 2016 and January 2017 were down to the NHS, which may be what Mr Nuttall was referring to.
“We’ve got over one million vulnerable people who can’t look after themselves because of cuts to social care.”
Rebecca Long-Bailey, 4 May 2017
The Labour Party told us that Ms Long-Bailey was referring to the estimated number of over-65s living with unmet social care needs in England.
There were 1.2 million older people in 2016 who either receive no help or insufficient help with basic tasks, according to analysis by the charity Age UK.
Over one million living with one or more unmet care needs
The Age UK analysis looked at the number of people over the age of 65 reporting that they had difficulty carrying out basic tasks like eating, washing and using the toilet, using survey data from the English Longitudinal Study of Ageing. It then looked at the number of people reporting difficulties in these areas who said they either received no assistance or who did not receive enough assistance.
If you add in the over 65s who report they didn’t receive enough help with essential activities such as taking medication or preparing food, the total rises to around 1.5 million.
We’ve looked at Age UK’s findings before and have already highlighted that it could be clearer in explaining how it reached the 1.2 million figure, for instance showing which population figures it has used to arrive at the headline figure.
That said, the King’s Fund think tank has warned separately that “defining, let alone measuring, the extent of unmet need is fraught with difficulty.”
Councils’ spending on social care has decreased in recent years
Around £16 billion was spent by councils on providing social care for adults in 2015/16, that’s down 6% in real terms since 2009/10.
There were 873,000 people over the age of 18 receiving long-term social care provided by local authorities in 2015/16. There were also 245,000 instances of short-term support provided to maximise someone’s independence.
The number of people over the age of 65 receiving publicly funded social care has decreased by 26% between 2009/10 and 2013/14, according to the King’s Fund. It points out that while part of this change may be down to improvements that mean some people who once would have needed social care are now able to live independently without it, “access to care had been tightened considerably over the past decade” and the figures for unmet needs suggest that more people should require social care.
“The rate of use of non-NHS healthcare was much higher; the growth rate was much higher under Tony Blair's Labour than it has been under the Conservative and Coalition governments.”
David Davis, 4 May 2017
This is overstating the available figures, and the wording of the claim needs some clarification.
The Conservatives indicated to us Mr Davis was talking about the proportion of the NHS budget which goes to private providers, not all non-NHS providers. He’s comparing Labour’s record since 2006/07 with that of the Coalition and Conservative governments.
Using these figures, the rate of growth in private providers is very similar under both governments, and is higher under Labour counting its spending up to 2010/11.
‘Privatisation’ in context
When people refer to NHS ‘privatisation’, they’re often talking about NHS services that are outsourced to private providers. The use of non-NHS providers to supply NHS-funded hospital care is something that divides public opinion.
‘Non-NHS healthcare’ isn’t the same thing as ‘private’ healthcare. A small amount of the care we receive is also provided by local authorities and charities, purchased by the NHS.
About 7.6% of NHS revenue spending in 2015/16 went on purchasing care just from private providers, according to Department of Health accounts. If you include all non-NHS providers then this goes up to 10.7%.
The government recently published figures on the proportion of the NHS budget spent just on private providers over the past five years and provided older figures to us at the last election in 2015. Using this we can reconstruct a rough picture of what’s been happening since 2006.
2.8% of NHS spending went to private providers in 2006/07, rising to 4.4% in Labour’s last full year in government and 4.9% in the first year of the Coalition.
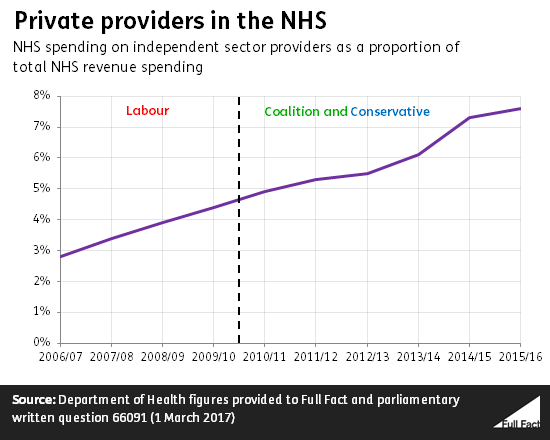
The rate of growth is actually very similar in Labour’s last years in office compared to the Coalition and Conservative governments. Who is higher is different depending on whether you count 2010/11’s spending as under Labour or the Coalition, which is ambiguous.
The proportion of spending on private providers under Labour rose by 75% if you include 2010/11, compared to 55% since then, those figures are roughly reversed if you look at Labour just up to 2009/10.
Previous research from the King’s Fund has shown that the rate of use of private providers isn’t the same across the NHS. Between 2011/12 and 2012/13 for instance, community health services saw increases in purchases of private care while spending in acute care fell between 2010/11 and 2012/13.
Spending is just one way to measure the level of private involvement in the NHS, another is to look at the proportion of contracts for providing services that they hold. Looking at it this way, a larger proportion of contracts are in the hands of private providers because they tend to hold much smaller contracts than NHS providers.
For example, according to one estimate private providers only accounted for 5% of spending on community care contracts in England, they held 39% of them in 2016. that’s according to Freedom of Information requests from 78% of CCGs gathered by the Health Foundation think tank.
“They’ve cut money to any third, fourth or fifth child in a family, unless the mother can prove that she was raped when that child was conceived.”
Leanne Wood AM, 4 May 2017
Recent changes to Child Tax Credit mean you won’t get money per child for more than two children if the third child was born after 6 April 2017. There are five exceptions to this cap, including one for non-consensual conception of a child. For that exception a criminal conviction for rape doesn’t need to be proved but evidence of non-consensual sex does need to be provided.
Ms Wood was referring to recent changes to Child Tax Credit
From 6 April 2017 you won’t get the child element of Child Tax Credit for more than two children who were born after that date.
There are five exceptions to this limit, including for children born as a the result of non-consensual conception— this means the cap doesn't apply to children born from non-consensual sex.
The lack of consent to sex can be because the relationship was controlling or abusive, which meant the victim didn’t have the “freedom or capacity” to say no.
What does the exception for non-consensual conception require a claimant to prove?
First, you can’t claim this exception if you live with the other parent of the child.
Second, there doesn't need to be a court case or criminal conviction relating to the non-consensual sex or abusive relationship. So the criminal offence of rape doesn’t have to be proved.
You have to provide one of three forms of evidence of non-consensual conception:
- Evidence of a conviction for rape, controlling or coercive behaviour in an intimate or family relationship, or a similar crime abroad, that related to the conception of the child.
- Proof of a compensation award for a crime relating to the conception of the child. This is money paid by the government to victims of violent crime for harm caused by the crime.
- A statement from someone on a list of approved professions and organisations.
It’s unclear what evidence exactly is required for the first two categories and we have asked for further guidance from HMRC.
The HMRC guidance on this exception states that claimants don’t need to speak to or give details of conception to HMRC staff, although they do have to fill in a form.
For individuals with a statement (the third form of evidence) they only have to fill in their basic details such as name and address, the professional fills out the rest.
For individuals providing either of the first two types of evidence it’s not clear if that evidence is to be directly provided by the claimant on the form or a third party. We’ve asked HMRC to clarify.
Contacting Victim Support
The Victim Support team can be contacted 24/7 on 08 08 16 89 11 or by email here.
Labour party confidence in Jeremy Corbyn
On BBC Question Time David Davis responded to a question about media bias against the leader of the Labour party, Jeremy Corbyn:
“Well, I'm afraid they are reflecting a view not just of the media but of three quarters of the Labour party who passed a vote of no confidence in him last year.”
David Davis, 4 May 2017
We’re not going to get into the discussion of bias, but there is a factual point embedded in Mr Davis’ claim which we can clarify.
If you interpret “the Labour party” to mean all its members, not just MPs, the claim isn’t correct.
In June 2016 three quarters of Labour MPs in the House of Commons voted in favour of a motion of no confidence in Mr Corbyn. 172 voted in favour, 40 voted against the motion, 4 spoilt their ballots, and 14 didn’t vote. A leadership challenge followed.
Mr Corbyn was re-elected as Labour leader by the wider Labour party, winning 61.8% of the overall vote. He won votes from 59% of Labour party members, 70% of registered supporters, and 60% of affiliated supporters (the three categories of people who could vote).