BBC Question Time: factchecked
Question Time this week was in Colchester. On the panel were: Business Secretary Greg Clark MP, Shadow Home Secretary Diane Abbott, former Commissioner of the Metropolitan Police Sir Bernard Hogan-Howe, writer Dreda Say Mitchell, and former chairman of Marks and Spencer Lord Rose.
Join 73,000 newsletter subscribers who trust us to check the facts
Sign up to get weekly updates on politics, immigration, health and more.
Subscribe to weekly email newsletters from Full Fact for updates on politics, immigration, health and more. Our fact checks are free to read but not to produce, so you will also get occasional emails about fundraising and other ways you can help. You can unsubscribe at any time. For more information about how we use your data see our Privacy Policy.
“It doesn't matter who you refer to, whether it’s the IFS, whether it’s the ONS, whether it’s the Bank of England. All the indicators are that we have gone from being one of the top [economic] performers in the G7, one of the top performers in the world, one of the top performers in Europe in terms of growth, and we are now nearly at the bottom of the league. And that's happened in the last six or 12 months.”
Lord Rose, 23 November 2017
It’s correct that if you look at the UK’s GDP growth for the last few quarters it’s among the lowest in the G7 and lower than the EU average. It’s also much lower than other countries like China and India, but the comparison isn’t very helpful.
Before then, the UK was one of the top growing economies in the G7 and was above the average for the EU.
GDP is the total value of goods and services produced in a country.
There are other ways of comparing countries’ economic performance, but we’re focusing here on growth as Lord Rose referred to.
GDP growth: where are we now?
The Institute for Fiscal Studies said this week that once you compare various forecasts for GDP growth between 2016 and 2022 “the UK comes out well behind all of them [other G7 countries] with only Canada even within touching distance. And we don’t have to rely just on forecasts. The UK is currently growing more slowly than other advanced economies.”
The latest figures from the Office for National Statistics put the UK at the lower end of the G7 countries so far in 2017 in terms of GDP growth. It was at the bottom of the table in the first half of the year The Bank of England have also said the UK’s GDP growth in 2017 so far was lower than the average of the rest of the G7 countries.
The UK’s GDP growth was also below the average for the EU and the Eurozone from January to September 2017, according to the ONS. Looking at the individual countries in the EU, the UK also found itself near the bottom in terms of growth in each of the three quarters in 2017 so far and in the lower half of the league table in 2016.
It’s also well behind that of countries like China and India. Their growth consistently outstrips those of 'advanced' economies, but it's not always as helpful to compare these countries to the UK. As countries that have had less developed economies in the recent past they are now growing a lot faster than countries like the UK and Germany.
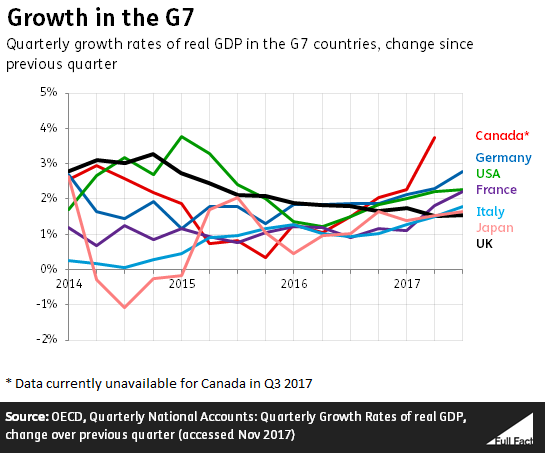
The UK had the fastest growing economy in the G7 in 2014
The UK had the fastest growing GDP in the G7 in 2014, and was joint first in 2016. The UK’s GDP growth hasn’t been above the average for the EU since early 2016 if you compare GDP growth from one quarter to the next.
“It takes people in Germany four days to produce what people in the UK take five days to produce. And that means that they can pay themselves better, or they need to work fewer hours [...] This is a long standing challenge of the British economy…”
Greg Clark MP, 23 November 2017
On average, UK workers were 26% less productive per hour than German workers in 2016.
So it took German workers around four hours to produce what UK workers did in five hours.
Workers in the UK work longer days on average than German workers. This pushes up the amount each UK worker produces in total. So overall, UK workers were 8.5% less productive than German workers in 2016.
The gap between the two countries was wider in 2015 when it took German workers less than four hours to produce what UK workers did in five hours.
And, as Mr Clark says, most German workers earn more per hour than most UK workers (at least, they do according to figures from 2014).
‘Productivity’ isn’t just about how hard people work. The OECD says it’s about efficiency and innovation too. ”Working smarter”, rather than “working harder”.
People think it can be improved by investment in things like infrastructure, education, management and technology. For example, you’d be more productive if your boss bought you a faster computer, even if you put the same amount of effort into your job.
Unfortunately, there’s no single answer on exactly how to solve the UK’s “productivity puzzle”, as the Bank of England put it, or exactly why it exists. It’s likely to be multiple factors at play. We’ve talked some of these issues in the past.
“There are people paying astronomic rents nowadays. 60% of your income on rental.”
Diane Abbott, 23 November 2017
There are 12 local authorities where the person on the average salary would have to spend 60% or more of their income to pay the average private rent, according to the Office for National Statistics.
These areas are all in London, including Hackney where Ms Abbott’s Hackney North and Stoke Newington constituency is located.
We don’t know how many people are actually paying these kinds of rates but it does give a sense of how affordable rent is in different areas.
The figures are based on the median average. In other words they line up all the rents from smallest to largest, and take the one in the middle. And they do the same for salaries. The person paying the median rent is probably not the person getting the median salary. The median salary is divided by the median rent to produce the ratio.
The House of Commons Library produced a map of the data, shown below.
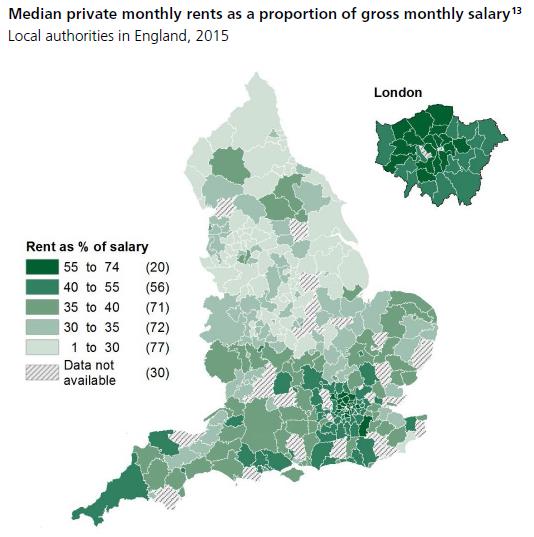
Across England, private renters spent an average of 35% of their income on rent in 2015/16, using the mean not median average.
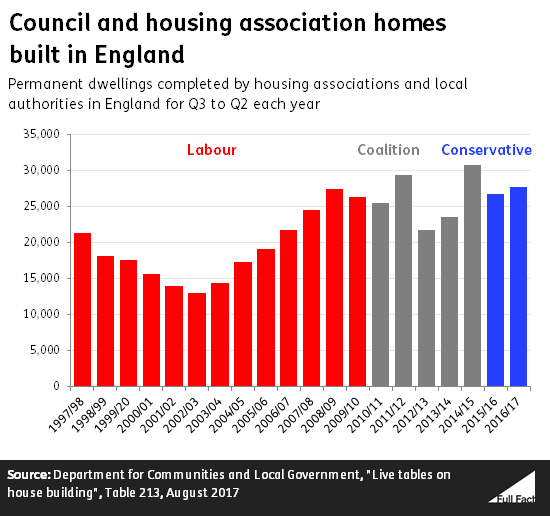
“There are more council houses that have been built in the last seven years than under the entire period of Diane's period in government.”
Greg Clark MP, 23 November 2017
Technically more council houses have been built since 2010 than during the 13 years of Labour but most new social houses aren’t council houses.
Housing associations are private non-profit organisations, which have built the vast majority of low cost social housing since the mid-1990s. Local authorities build comparatively few houses these days.
Taken together, we can see that more social housing was actually built during the previous Labour government than since then.
During the Labour governments of 1997-2010 local authorities built just under 3,000 homes in England. During the Coalition and Conservative governments of 2010-2017 they built just fewer than 11,000.
Under Labour, housing associations and local authorities built about 251,000 homes in England. Since then, they’ve built roughly 186,000 homes.
On average, housing associations and local authorities have built around 26,500 houses each year since 2010. The Labour government had a lower average, building about 19,000 homes per year.
These figures are based on the number of homes completed, rather than starting to be built. Houses completed early in the life of one government will have been started under the previous one, and it can take time before a new housing policy is introduced and has an impact on building. That said, counting completions gives us a better sense than housing starts of the number of homes being made available to live in.
Housing is devolved to Scotland, Wales and Northern Ireland, so the UK government is only responsible for housing in England.
“It was bankers who were not properly regulated that tipped us into the economic crisis which we are still struggling with. I'm not against bankers, no, not really, but they should have been properly regulated.”
Diane Abbott MP, 23 November 2017
“Why did no one see it coming?”, the Queen asked a group of economists about the recession.
Eight months later, and after much debate, Her Majesty got a three-page letter back from the British Academy. It identified many problems including poorly-understood financial instruments, psychological factors, and above all a failure to understand the financial system as a whole.
It had this to say on regulation: “Among the authorities charged with managing these risks, there were difficulties too. Some say that their job should have been ‘to take away the punch bowl when the party was in full swing’. But that assumes that they had the instruments needed to do this. General pressure was for more lax regulation—a light touch. The City of London (and the Financial Services Authority) was praised as a paragon of global financial regulation for this reason.”
So the regulators were doing what they were asked to, which isn’t much comfort.
Anything this complicated has lots of causes but nobody seems to doubt that the regulation wasn’t up to scratch. “There is much to be improved [on regulation]… but not everything is broken” was the best a post-crash report on financial services for the Chancellor could offer.
A review by the Financial Services Authority’s Chairman found that “the crisis revealed fault lines in the global regulation and supervision” of some cross-border firms as well as many other problems.
Even good regulation isn’t enough, according to the regulators. The CEO of the Financial Conduct Authority in a 2015 speech said: “The culture was just as broken as the balance sheet. Hence the succession of scandals that all of us in this room have witnessed. The building blocks of this repair are much more complicated. […] Regulators cannot become the conscience for the financial world.”