BBC Question Time: factchecked
This week Question Time was in Birmingham. On the panel were Theresa May's former deputy Damian Green MP, shadow health secretary Jon Ashworth MP, Wetherspoon founder and chairman Tim Martin, journalist and author Afua Hirsch, and Spiked columnist Ella Whelan. We factchecked claims on social care funding, drug-related deaths, Labour's manifesto pledges on NHS spending, whether the country is getting unhealthier, and sexual harassment in the workplace.
Join 73,000 newsletter subscribers who trust us to check the facts
Sign up to get weekly updates on politics, immigration, health and more.
Subscribe to weekly email newsletters from Full Fact for updates on politics, immigration, health and more. Our fact checks are free to read but not to produce, so you will also get occasional emails about fundraising and other ways you can help. You can unsubscribe at any time. For more information about how we use your data see our Privacy Policy.
“Because of deep cuts, £6 billion worth of cuts over the last eight years, 400,000 very elderly and vulnerable people did not get the care support that they used to get before these cuts. That is costing the NHS £3 billion a year. And Damian said there was going to be a plan for that, there was no extra money whatsoever, this week, for social care.”
Jonathan Ashworth MP, 21 June 2018
“There was two billion last year, and you know that well, Jon.”
Damian Green MP, 21 June 2018
A survey of councils in England by ADASS last year found that by the end of 2017/18 they expected to have made “savings” of around £6.3 billion since 2010. This was the cumulative difference between what social care departments in local councils wanted to spend money on each year, and what there was available budget for. We’ve written more about these figures here.
Newer figures from the annual ADASS survey suggest that by the end of 2018/19 these planned savings will total £7 billion.
Spending on adult social care in England fell by 3% between 2009/10 and 2017/18. That followed a fall of 10% to 2014/15, followed by a rise of 7% after that following council tax increases, money from the NHS going towards adult social care and new government grants.
There were 1.7 million people receiving adult social care from their local council in 2009/10, compared to around 1.3 million in 2013/14. That's a fall of around 425,000. Since then NHS Digital, which publishes the figures, has changed the way it records the data so we can’t compare this with more recent figures.
The Health Foundation think tank says that many councils have been "tightening eligibility criteria and concentrating care and support on those with the highest needs" in recent years in response to having lower overall budgets.
New funding announced, but not for social care
This week the Prime Minister announced that the NHS in England would see its budget increased by around £20 billion by 2023/24. We've written more about that here. There was no new money announced for adult social care in England although the Prime Minister said that the government will set out a budget for this at a detailed review of public spending planned in 2019.
The Health Foundation has said that "3.9% annual increases in social care spending would be the minimum needed, just to continue the current level of service provision for projected demand for social care services, which are expected to rise by around £18bn by 2033/34."
In March last year the Chancellor announced that there would be around £2 billion more over the next three years (until 2019/20) to be pooled between councils and the NHS in England. This money is to “support social care providers and relieve pressure on the NHS locally”. At the time the King’s Fund think tank said the money was “best viewed as a down payment, in the hope of further instalments to come.”
We’re going to look into Mr Ashworth’s claim that reductions in social care spending have cost the NHS £3 billion a year. It’s originally based on a report published last year by Carnall Farrar, a management consultancy.
“Even Labour at the last election said that an increase of 2.2% would make the NHS the envy of the world. We'll be increasing spending by 3.4%.”
Damian Green MP, 21 June 2018
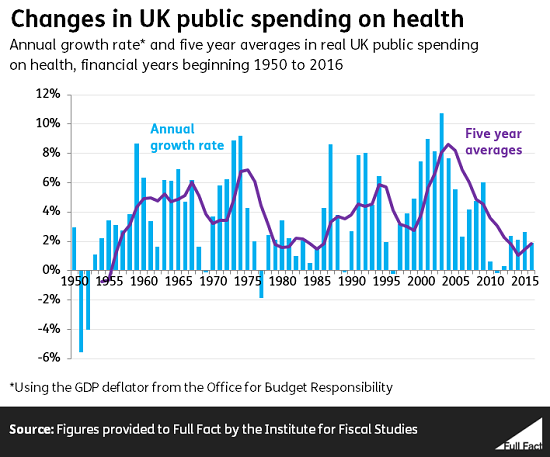
At the start of the week the Prime Minister announced an extra £20 billion for the NHS in England in real terms by 2023/24, which works out at spending increases of 3.4% per year on average.
At the 2017 election the Labour manifesto committed to “over £30 billion in extra funding over the next Parliament” [to 2021/22]. That would amount to “an average increase of 2.2% a year in real terms funding” for the rest of this decade, according to analysis by the Health Foundation. Similar figures were reached by the Institute for Fiscal Studies.
Labour’s manifesto also said at the outset: “Let’s build a country where we invest our wealth to give everyone the best chance. That means … restoring the NHS to its place as the envy of the world”. The party didn’t directly connect this to its specific spending plans for the NHS.
So the funding increases the NHS is now set to get are higher, at least in the first few years, than Labour’s plans at the last election.
But that’s only part of the story.
3.4% is also a lot more than the Conservatives initially pledged in 2017. Their plans were less generous than Labour’s, amounting to 1.2% per year until 2020/21 according to both think tanks.
That’s similar to the funding increases under the Coalition government until 2014/15. The historical average for health spending across the UK was 3.7% a year between 1950/51 to 2016/17.
Even though Labour’s plans were more generous, neither party pledged enough funds to meet growing demands on the NHS. The Health Foundation said Labour’s plans would leave a £7 billion funding gap by 2020/21, while the Conservative plans would have left a £12 billion gap.
The latest 3.4% outstrips both of those, and will “help stem further decline in the health service” according to the Health Foundation. But they and other health think tanks say funding needs to increase by at least 4% a year in real terms in order to meet the NHS’s needs.
We’ve written more about this in our explainer on the government’s funding announcement.
“The number of drug-related deaths is the highest it’s ever been in this country since the 90s.”
Jonathan Ashworth MP, 21 June 2018
This is correct. There were around 3,700 deaths related to drug poisoning in England and Wales registered in 2016, which is the highest number since comparable records began in 1993.
These deaths can involve both illegal and legal drugs, like those available on prescription, or over the counter. The definition includes accidents, suicides and assaults involving drug poisoning and deaths from drug abuse and dependence.
Drug-induced deaths are mostly certified by a coroner, and because of this, there are usually delays between the occurrence of death and its cause being registered. Just under half of drug misuse deaths registered in 2016 (1,200) happened in the years before that.
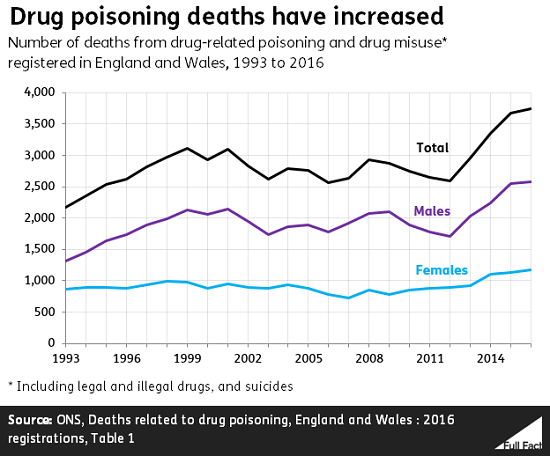
The sharp increase in deaths between 2012 and 2015 was driven by deaths involving heroin and morphine more than doubling between those years. In 2012, 580 deaths “involving heroin and/or morphine” were registered—three years later 1,200 such deaths were registered. The ONS said this was “partly driven by a rise in heroin purity and availability” over that period.
In 2016, just over half of deaths related to drug poisoning involved an opiate, like heroin or morphine.
And the Office for National Statistics says over half of 2016 drug poisoning deaths involved “more than one drug and/or alcohol”, and it’s not always possible to tell which substance was the main cause of death.
Not all drug poisoning deaths were down to acute overdoses—some may have been down to complications, for example, septicemia after taking a substance intravenously.
But the figures for drug poisoning don’t include every kind of drug-induced death—the ONS gives the examples of anaphylactic shock or car crashes where the driver was using drugs which aren’t included.
Around 70% of the 2016 drug poisoning deaths were categorised as “drug misuse” deaths. These are when the underlying cause of death was drug abuse or drug dependence, or drug poisoning involving a controlled substance. Most of these drug misuse deaths are deemed accidental poisonings—around 80% for male deaths and 70% for female.
The death rate under the wider drug poisoning definition is increasing too. For men, there were around 90 deaths per million of the population in 2016. That’s an increase from 50 since 1993. For women it was 40 deaths per million in 2016, from about 35 in 1993.
For the narrower drug misuse definition deaths, for men, there were just under 70 deaths per million in 2016. For women it was around 24.
“Diabetes is on the rise, mental health is on the rise, cancer is on the rise.”
BBC Question Time audience member, 21 June 2018
Incidences of cancer and diabetes are on the rise. In the case of diabetes, there is a strong suggestion that this is linked to lifestyle factors, but with cancer the factors are more complex. It’s harder to measure the change in the number of people with mental health conditions over time.
Cancer
There were around 300,000 new cases of cancer in England in 2016—excluding non-melanoma skin cancers. That’s compared to around 250,000 a decade before.
The proportion of women being diagnosed each year is increasing, while the proportion of men has fallen in recent years.When controlling for changes in the population age over time, the incidence rate of cancer has increased for women in England from 516 per 100,000 in 2006 to 541 in 2016. For men, it has fallen slightly, from 671 per 100,000 in 2006, to 663 in 2016.
Research by the British Journal of Cancer in 2015 estimated “Much of this increased risk [of cancer over time] is due to increasing longevity.” Adults aged over 65 accounted for 65% of cancer diagnoses in England in 2016, and life expectancy in the UK has also been steadily increasing (though it’s slowed down in recent years).
Cancer Research UK also highlighted that there are many other factors at play, including “our lifestyle, our genetics & family history, our exposure to viruses, the job we do, the air we breathe”.
Diabetes
The number of people living with a diagnosed case of diabetes has been rising year-on-year in the UK. Around 3.7 million people had a diagnosed case of diabetes in 2017, according to the charity Diabetes UK—almost twice as many as in 1998.
It also estimates that, including undiagnosed cases, 4.6 million people in the UK are living with diabetes. We’ve asked it for more information about the figures. Public Health England estimated in 2016 that over 900,000 people in England alone are unaware that they have diabetes.
Public Health England says that Type 2 diabetes (which accounts for about 90% of cases in England) is “largely preventable or manageable by lifestyle changes... although family history, ethnicity and age can also increase risk”.
Mental health
Figures on the number of people with mental health conditions are not produced so regularly, so it’s harder to track change over time.
“One in four” is widely cited in the UK as the number of people who suffer from a mental health problem.
The estimate has been around since the 1980s, although a commonly cited source for the figure is the 2007 Adult Psychiatric Morbidity Survey (APMS). This found that 23% of people in England had at least one psychiatric disorder at some point in that year, and a third of these—7.2% of people—had more than one.
Because each condition included in the 23% figure has a different time frame it’s not meaningful to use the data to say this many are ill in every year, or in any other time period. But the findings do suggest that the number suffering over a lifetime will be more than one in four.
A more recent APMS (covering 2014) doesn’t provide an update on the one in four figure though.
It did report that one in six people in England had a common mental disorder (CMD) in the week before they were interviewed for the study. This, according to the researchers, suggested that around this many could be expected to have a CMD at any one time. These CMDs included things like generalised anxiety disorder, obsessive compulsive disorder and panic disorder.
“One third of women in the UK report having been harassed in the workplace and 70% said they didn’t feel able to report it.”
Afua Hirsch, 21 June 2018
A survey last month found that about a third of women had experienced sexual harassment at work. It also found that 46% of women experiencing bullying or harassment of any kind (not just sexual harassment) had reported it. We believe this was the source for the claim though haven’t been able to contact Ms Hirsch to confirm.
The study also surveyed men and looked more widely at unwanted workplace behaviour, not just sexual harassment.
This study only surveyed members of the Prospect union, which focuses on professionals, managers and craftspeople, and so isn’t representative of UK workers generally.
Other estimates for sexual harassment vary a lot depending on whether the survey question specifies acts of sexual harassment, or leaves the respondent to define sexual harassment themselves.
One survey estimated that 20% of women in the UK currently working reported experiencing sexual harassment in the workplace, leaving it up to the respondents to interpret what they considered sexual harassment. Of those women, 58% had never reported instances of sexual harassment to their employer or someone in authority at work. A further 28% had reported some instances but not others.
Some men also experience sexual harassment. One survey estimated that 7% of men had experienced workplace sexual harassment and 56% of those men had reported at least one instance of it. For the rest of the article we concentrate on the female experience of workplace sexual harassment as the claim from Question Time did.
Defining sexual harassment has a big effect on how large the problem appears to be
Sexual harassment in the workplace often goes unreported, which means the best available source of data to understand the scale of the issue is asking people anonymously in surveys.
Over the past year, many pollsters have published surveys on this, and the results vary considerably from 20% of women reporting that they’ve experienced sexual harassment at work to 53%.
One of the key things that affects the results appears to be whether surveys define sexual harassment. In surveys that don’t specify what sexual harassment is, the proportion of people saying they have experienced it are lower.
Sexual harassment is legally defined as when one person subjects another to unwanted conduct of a sexual nature leading to violation of dignity, or creating an intimidating, hostile, degrading, humiliating or offensive environment.
Some surveys give specific examples of things that constitute sexual harassment, like “inappropriate jokes” which isn’t as clear cut against the legal definition. For example, there’s evidence that inappropriate sexual jokes are not considered sexual harassment by 30% of women.
One pollster, ComRes, surveyed UK adults in October and found 53% of women had experienced sexual harassment in the workplace or place of study, but in December found only 25% had.
The key difference in the surveys was that in the October study, they defined sexual harassment, but in December left it up to the respondents to decide whether the behaviour they may have encountered constituted sexual harassment.
The inclusion of “place of study” in these surveys also means the results are likely higher than if they had looked solely at workplace harassment.
Who you survey also makes a difference
It’s also difficult to put a precise number on workplace harassment, as many surveys look at different groups. The data referenced during Question Time seems to refer to a survey of working current members of the Prospect union, and so isn’t representative of the working population as a whole.
A survey done by Opinium in September surveyed people currently working in the UK, meaning they excluded people who are retired.
ComRes surveyed a sample of all adults in Britain, meaning they interviewed some retired people who had worked previously, but also may well have included people that had never worked. This could have the effect of underestimating the proportion of people experiencing workplace sexual harassment. That’s because by surveying a group of people who have never worked, you dilute the numbers of people who have experienced workplace sexual harassment.
The reporting of sexual harassment is inconsistent
Estimates for how many women don’t report workplace sexual harassment also vary, but the figure of 70% seems to be in the right ballpark.
The Opinium survey of UK workers found 58% of women never reported instances of sexual harassment and another 28% sometimes reported sexual harassment.
The ComRes survey from November 2017 found 71% of women didn’t report sexual harassment—but this survey didn’t allow for women to say they had reported some instances but not others. The only answer options were essentially “yes” and “no”.
What none of these surveys tell us is why women do not report all instances of sexual harassment.