This is correct. The number of children living in low-income families increased from around 2.5 million to almost 2.75 million across the UK between 2013 and 2014 under the Coalition government, according to HM Revenue and Customs.
This is an increase from just over 18% of all children (or at least, all children in families receiving Child Benefit) to 20%.
But the number and proportion of children in poverty according to this measure has been broadly stable since the change of government in 2010.
Child poverty levels have returned to those seen around 2010
These children are in families receiving certain benefits such as Jobseeker’s Allowance or Child Tax Credit. They often have an income which is considerably below the average.
Although the percentage of children in low-income families increased by 2% on the previous year, it’s a return to the levels found in 2010.
Around 2.8 million children, or 21%, lived in low-income families in the year the Coalition government was elected, according to HMRC.
Rather than being a figure for the whole year, this is just the number who were classed as being in low-income families on a single day in August.
A family is said by HMRC to have a low income if they receive Jobseeker’s Allowance or Income Support, or if they get Child Tax Credit or Working Tax Credit and their income is 60% less than the median income. The median income is the income in the middle if you lined up every family’s income in the UK.
The proportion of children in low-income families is calculated by dividing the number of children in families receiving these welfare payments by the number of children in families receiving Child Benefit. This is rather than using some other measure such as the census or birth records to calculate how many children there are in the UK.
HMRC say that using Child Benefit figures to count children is “the most comprehensive assessment of the number of children available at the local level.” The most recent estimate is that around 95% of all eligible children and young people have Child Benefit claimed on their behalf.
But HMRC also points out that changes to the way Child Benefit was awarded in 2013 mean that “the measure may not be as complete as it has been previously due to families with higher incomes no longer claiming Child Benefit.”
The proportion of children in low-income families is only increasing for some categories
The trend isn’t consistent across all families measured to have a low income.
The percentage of children defined as being in low-income families because the family receives Income Support or Jobseeker’s Allowance has been decreasing. In 2014 this was 1.87 million or 68% of all children in low-income families. In 2010 it had been 2.23 million or nearly 80%.
In comparison the proportion of children in families receiving Child Tax Credit and/or Working Tax Credit, and who have an income below 60% of the median, has increased.
Not all of the families listed as receiving Income Support or Jobseeker’s Allowance have a low income. HMRC says that it doesn’t have information about the incomes of the whole group, so the figure includes all families who receive these two welfare payments, not just those who earn less than 60% of the average.
The government says this isn’t because families are getting poorer
HMRC says the rise is down to an increase in the number of families earning 60% less than the median, not because families with children are getting poorer.
The threshold below which a family is considered to have a low income went from £334 a week to £387 (for a couple with two children) between 2013 and 2014. For a single parent with two children it went from £262 to £304 over the same time.
There are different ways to measure this
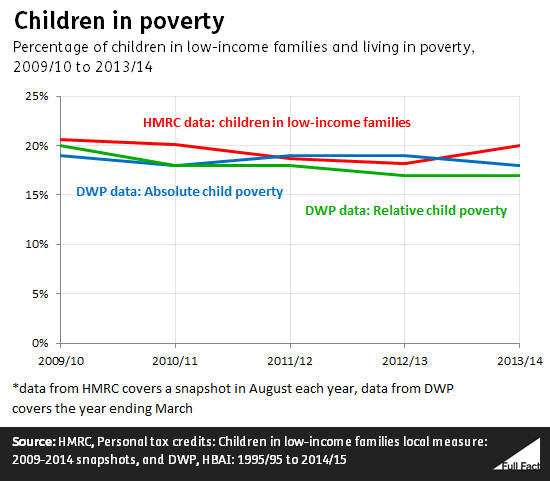
As ever, there are different ways of measuring child poverty. The data reported by the Independent and the Mirror looks at figures from HMRC.
If you look at data on child poverty from the Department of Work and Pensions the figures are slightly different and are measured across the whole year, rather than on a single day.
But since 2010 the level of child poverty has remained fairly stable whichever way you measure it.
We’ve looked into poverty
across age groups here.
Update 17 October 2016
We updated this piece to clarify that not all children and young people are eligible for Child Benefit.