Has employment growth been driven by a rise in insecure, precarious work?
15 May 2017
What was claimed
At least a large part of growth in employment has been driven by an increase in insecure, precarious work.
Our verdict
That doesn’t seem to be the case for the UK jobs market overall. The picture for specific industries, regions and groups might be different and statistics will only ever give a limited insight into questions about job quality.
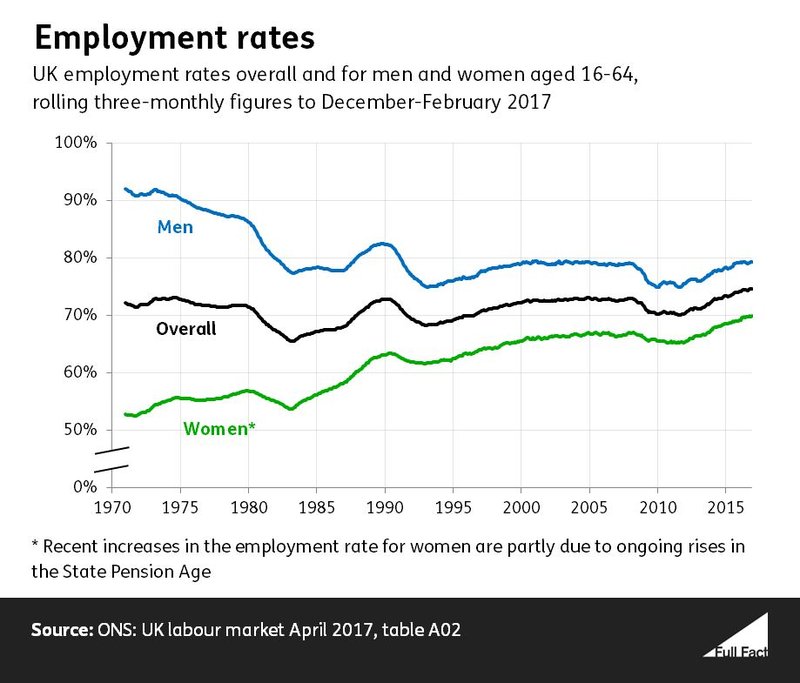
The employment rate in the UK is high by historic standards. At the beginning of 2017 a larger proportion of working-age people had a job of some description than had ever been recorded before.
But not everyone’s convinced that’s the whole story and some of our readers have questioned it in the past:
So how much of the rise in employment been driven by a rise in insecure, precarious work?
From the statistics, it doesn’t seem like unwanted part-time work or unsatisfactory temporary work has been the major driver behind the growth in employment.
It’s a question that’s hard to answer with statistics alone, partly because one person’s idea of a “good job” won’t suit another’s. Some people will value secure employment, others flexibility, and presumably most people will want a degree of both. How secure people feel will also depend on things like their relationship with their employer and their own disposition. So questions of job quality are hard to answer satisfactorily with numbers.
The proportion of workers who simply can’t find permanent or full-time jobs did increase after the recession but it’s been falling for the past few years now.
Join 74,000 newsletter subscribers who trust us to check the facts
Sign up to get weekly updates on politics, immigration, health and more.
Subscribe to weekly email newsletters from Full Fact for updates on politics, immigration, health and more.
Our fact checks are free to read but not to produce, so you will also get occasional emails about fundraising
and other ways you can help. You can unsubscribe at any time. For more information about how we use your data
see our Privacy Policy.
Six charts
The proportion of people who have a job has risen in the past few years to a record high (it’s been driven partly by a rise in the proportion of working-age women with a job).
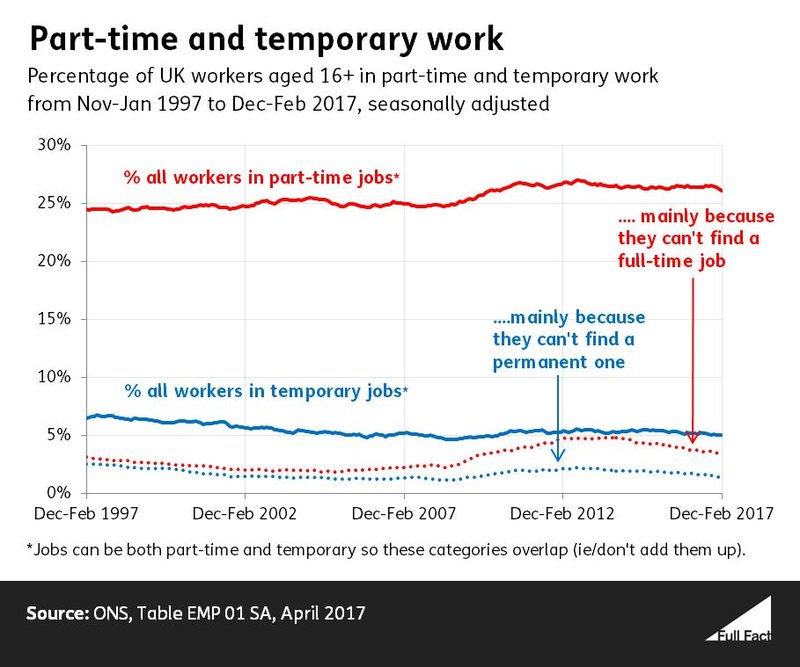
Some of those people have either part-time jobs or temporary work (or both).
Not all of them are happy about it. About 3% of UK workers work part-time mainly because they can’t find a full-time job. That is around 12% of the 8.4million part-time workers. Between 1-2% of people in employment have a temporary job mainly because they can’t find a permanent one. Around 28% of the 1.6 million temporary workers in the UK.
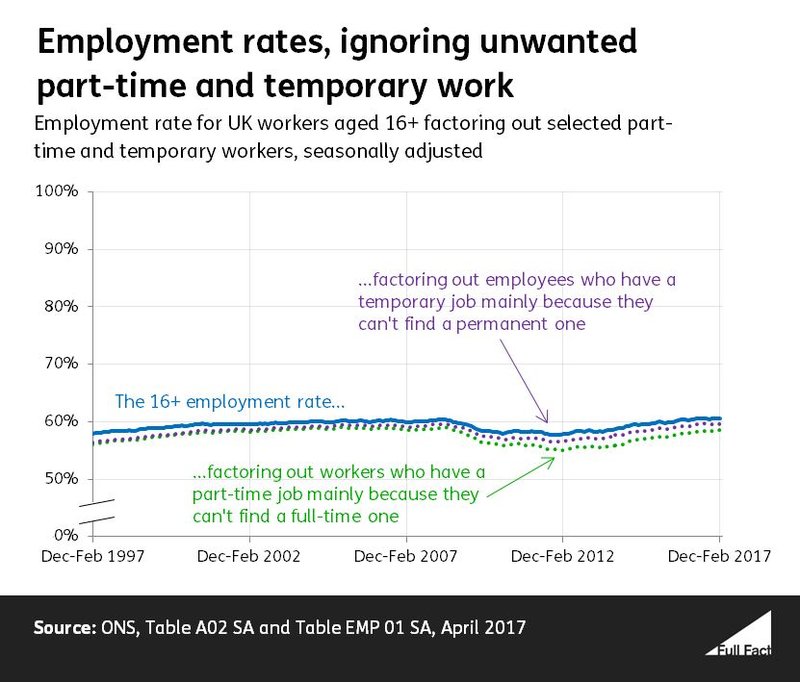
If we count these people out of the employment figures it makes very little difference to the overall picture. The employment rate for those aged 16+ is still relatively high by historic standards.
We’ve used the employment rate for everyone over the age of 16 in the graph below so that we’re using an age group which is consistent with the over- and underemployment statistics (which we’ll get to shortly). The 16+ employment rate is slightly lower than the 16-64 employment rate because it includes people above state pension age, an age group that’s less likely to be in work.
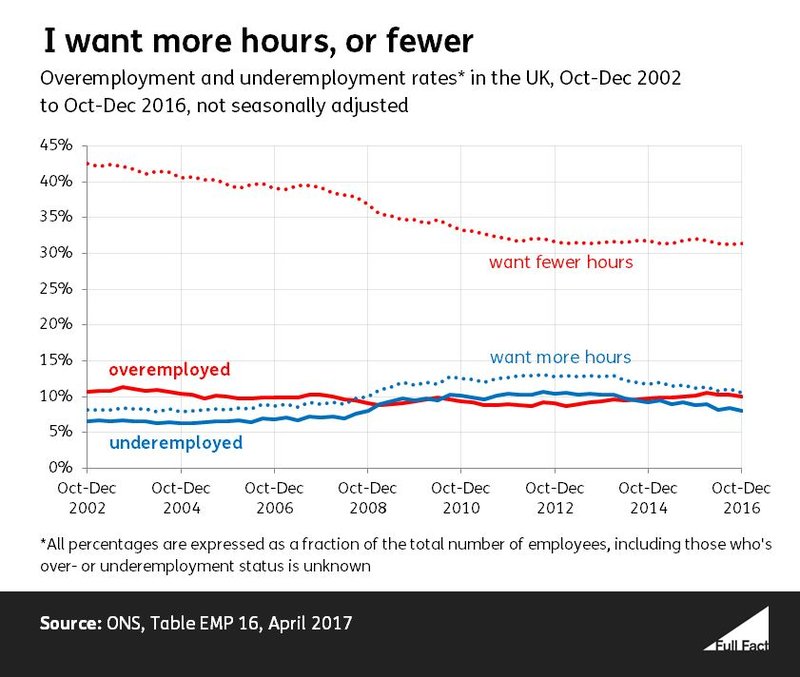
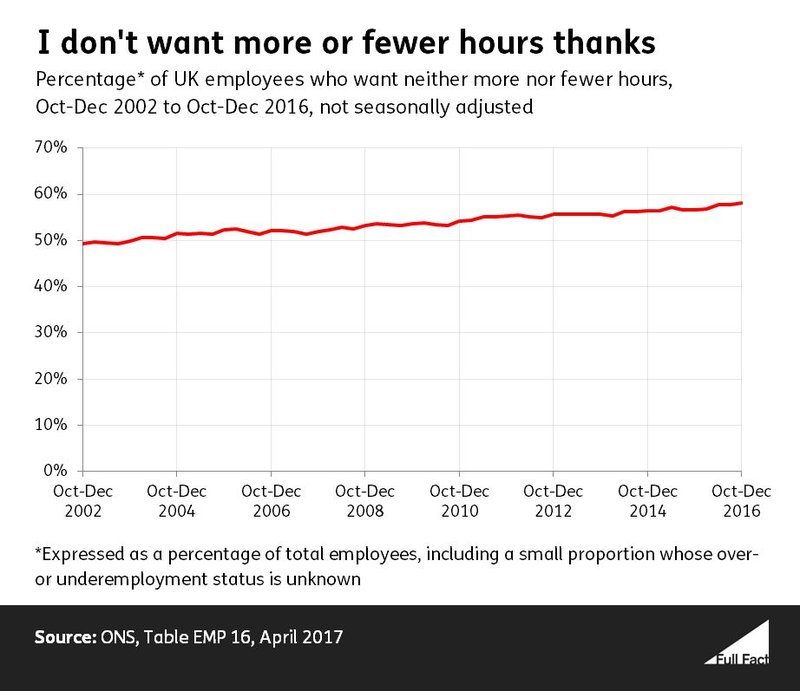
The Office for National Statistics also collects data on people who want to work more or fewer hours.
That’s a wider group than just the people who are technically “underemployed” or “overemployed”.
To count as “underemployed” you need to be seeking more hours, work no more than the maximum weekly working hours already, and be able to make the change within the next two weeks. About 11% of employed people say they’d like to work more hours. But 8% of people in employment meet the criteria and are classed as “underemployed”.
You’re only classed as “overemployed” if you want to work fewer hours and know you’d be prepared to take a pay cut to do it. About 31% of people with a job would prefer to work fewer hours, but only 10% say they’d definitely take a pay cut to do it.
The proportion of workers who are happy with their hours seems to have been steadily rising over the past fifteen years.
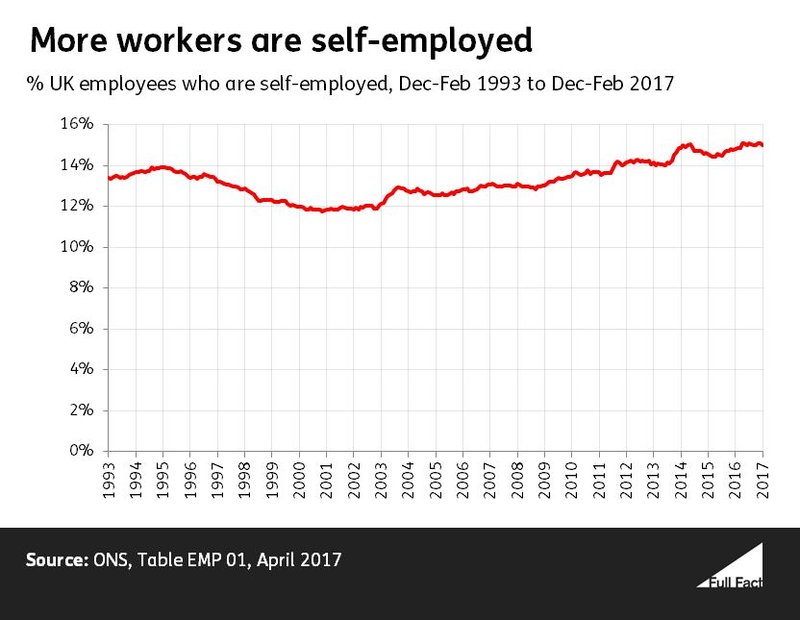
Self-employment has become more common too. There’s a fear among some that the economy is headed increasingly away from secure jobs and towards short-term, casual work.
The statistical evidence we’ve seen suggests that people are generally taking up self-employment happily.
We can also say that industries that make up the ‘gig economy’ still employ a relatively small proportion of the workforce. If these developments in the jobs market are a worry, it seems to be more of a concern about the direction of travel, rather than about where things are right now for most workers.
“The labour market is changing in interesting ways, but not fundamentally (yet).”
We can also say that the steady increase in self-employment started before the wide use of digital apps to contract piece work, a hallmark of ‘gig’ industries. The proportion of workers who are self-employed has been rising steadily for about 15 years.
About 2.8% of people with a job don’t have a guarantee that they’ll work a minimum number of hours. About a third of them want more hours and about a third of them consider themselves to be full-time in practice.
Totals and averages will never give you the whole picture
Many people’s perspectives won’t match the image of the labour market that comes from looking at national averages, as the chief economist of the Bank of England discussed last June.
But, at the very least, these aggregates give a wider context for debates about how the job market looks in specific industries or regions, as well as for specific genders, ethnicities, and social classes (however you define them).
The Institute for Fiscal Studies has also looked at what's been driving employment growth.
Fact checking claims made by politicians, public figures and viral online content can give you the full picture backed by the evidence.
Subscribe to weekly email newsletters from Full Fact for updates on politics, immigration, health and more.
Our fact checks are free to read but not to produce, so you will also get occasional emails about fundraising
and other ways you can help. You can unsubscribe at any time. For more information about how we use your data
see our Privacy Policy.