Labour's record on inequality and social mobility: 1997 to 2010
First published 17 June 2019
Updated
20 June 2019
What was claimed
The largest peacetime investment in public services happened between 1997 and 2010.
Our verdict
Total government spending as a share of the economy increased by 9.6 percentage points, a record compared to any other 13 year period since 1955 (the earliest we have data for).
What was claimed
The average wait for hospital inpatient care fell from over 13 weeks to four weeks between 1997 and 2009.
Our verdict
Correct for England.
What was claimed
There were over 44,000 new doctors in the NHS and 80,000 more nurses between 1997 and 2010.
Our verdict
The total number of FTE qualified nurses working in general practice and NHS hospitals increased by 79,000 and the number of doctors by 48,000.
What was claimed
Teacher numbers rose by 50,000 between 1997 and 2010 and support staff by 200,000.
Our verdict
Correct in England.
What was claimed
By 2010, 76% of pupils in England were achieving five good GCSEs, compared to 45% in 1997.
Our verdict
Correct.
What was claimed
The London Challenge for schools saw the most dramatic improvement in any major capital city anywhere in the world.
Our verdict
The London Challenge scheme did see an improvement in schools in the capital, but we don’t know of any way to benchmark this against schools in other major cities.
What was claimed
In 1999 the Labour government agreed a £2 billion settlement for miners suffering from bronchitis and emphysema. By 2005, 350,000 had received compensation.
Our verdict
The government did agree this settlement, as part of the liability they took on for British Coal. By January 2005, 172,000 claims had been settled and another 180,000 had received a final offer. In total the government expected payouts to miners for industrial injuries (not only from COPD) to total around £7.5 billion.
What was claimed
The Labour government lifted over a million pensioners and a million children out of poverty.
Our verdict
The exact level depends on the measure of poverty you use. Looking at absolute poverty the number of pensioner and children living in poverty both fell by well over a million. Meanwhile the number of pensioners living in relative poverty, after housing costs were accounted for, fell by over a million. The number of children in relative poverty fell by less than a million.
What was claimed
A report shows the poorest 10% of households gained around 13% in their incomes due to tax and benefit changes under Labour, while the richest lost almost 9%.
Our verdict
Correct.
What was claimed
A 2018 OECD report on social mobility showed from 1997 to 2010 found the UK had the largest fall of any nation in immobility and biggest rise in social mobility.
Our verdict
There are various measures in the OECD report. Looking at one of them, this is correct: the likelihood of someone still being in the poorest 20% of people in the UK after four years fell from 56% in the early 1990s to 45% in the early 2010s.
What was claimed
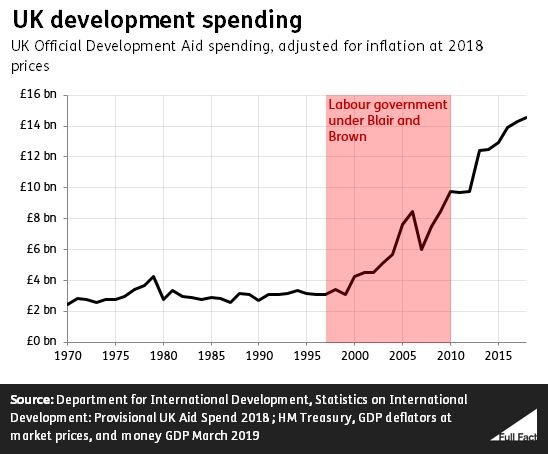
Labour tripled the amount of help to the poorest countries and the UK became the first major developed nation to achieve the 0.7% of GDP aid target.
Our verdict
It’s correct the amount of foreign aid from the UK roughly tripled between 1997 and 2010. The UK was the first country in the G7 or G20 to spend 0.7% of GNI on foreign aid, but this only happened in 2013 - after Labour left office - and several other European countries achieved this earlier.
The Tony Blair Institute for Global Change released a video last week defending the record of the last Labour government on inequality and social mobility. The video was pitched in response to a claim from Jeremy Corbyn that “for decades, we’ve been told that inequality doesn’t matter because the education system will allow talented and hard-working people to succeed whatever their background”.
The thrust of the video is to counter the implication that Tony Blair and Gordon Brown’s Labour governments did nothing to combat inequality during their time in office. Mr Blair goes on to list statistics about a range of topics from tax and spending, to education, NHS staffing and poverty.
The figures listed are pretty much all broadly correct, and we’ll look at each of them in turn below.
But it’s worth pointing out first that the video doesn’t actually provide any facts directly relating to overall income inequality under Labour. And this is one area where the available figures don’t quite compliment that government as much.
Join 73,000 newsletter subscribers who trust us to check the facts
Sign up to get weekly updates on politics, immigration, health and more.
Subscribe to weekly email newsletters from Full Fact for updates on politics, immigration, health and more.
Our fact checks are free to read but not to produce, so you will also get occasional emails about fundraising
and other ways you can help. You can unsubscribe at any time. For more information about how we use your data
see our Privacy Policy.
“We made the UK more equal”
It might sound unlikely, but a government can increase the incomes of the poorest, reduce the number of people living in poverty, and still oversee rising income inequality—if the incomes of high earners rise faster than those of low earners.
“Income inequality changed little”, is the verdict of researchers from the Institute for Fiscal Studies (IFS) in 2013 (the IFS is also quoted elsewhere in the video). They go on:
“inequality did fall across much of the distribution. Those on relatively low incomes did a little better than those with incomes just above the average. However, those right at the top saw their incomes increase very substantially with the result that, on most measures, overall inequality nudged up slightly.”
That said, the IFS does suggest that Labour’s increased spending on tax credits and benefits—which benefited poorer households, as we’ll cover in more detail later—might have prevented larger rises in income inequality than actually took place.
There are too many specific figures on income inequality to go into all of them here, but several key measures reflect the IFS’s conclusions. Inequality rose slightly under Labour according to the “Gini Coefficient”, which measures the overall distribution of incomes across the country. Other figures which compare the incomes of various groups at the poorer and richer end of the income scale tend to show broadly flat trends between 1997 and 2010 (usually following rises in inequality during the 1980s).
The full assessment from the IFS is available here.
“The period 1997 to 2010 saw the most dramatic improvements in our public services, with the largest ever peacetime investment in them.”
We asked the Tony Blair Institute what it meant exactly by this claim and it explained that it was actually referring to record increases in health and education spending—not that this was at all clear in the video.
However, whether you’re talking about education, health or total spending, the claim is correct.
In this section we’re using figures provided to us by the Institute for Fiscal Studies.
From 1996/97 (the year just before Labour were elected) to 2009/10 the amount spent on education increased in real terms by 83% from £56 billion to £103 billion while spending on health more than doubled in real terms from £64 billion to £136 billion.
Total spending increased by £326 billion in real terms over this period.
No other 13 year period since the Second World War saw such large increases in spending in any of these areas.
A more useful measure for public spending is to look at what percentage of the overall economy is spent in different areas, rather than the absolute amount of money spent.
In 13 years of Labour government, education spending as a share of GDP increased by 1.6 percentage points from 4.1% to 5.7%. This is an equal record increase along with the 13 year period to 1965/66 where education spending as a share of GDP also rose by 1.6 percentage points.
Health spending as a share of GDP increased by 2.9 percentage points from 4.7% to 7.6%. This was a record increase since the Second World War.
Finally, total spending as a share of the economy increased by 9.6 percentage points, also a peacetime record compared to any other 13 year period.
Data on “peacetime” spending doesn’t quite go back to the end of the Second World War. The figures from the IFS we’ve used are available from 1955/56.
“Between 1997 and 2009 the average wait for hospital inpatient care fell from just over 13 weeks to four weeks.”
Mr Blair is correct about the reduction in patient waiting times in England under Labour.
In March 1997, just before Labour took office, the average waiting time for an inpatient in England was 13.2 weeks. By March 2009 this had fallen to four weeks. In March 2010, just before Labour left office, the median wait was 4.3 weeks.
This refers to the average time between the decision to treat a patient to the date of the treatment.
“There were over 44,000 new doctors in the NHS. Over 80,000 more nurses.”
The total number of qualified nursing staff working in NHS hospitals and general practice in England increased by just over 79,000 between 1997 and 2010. The total number of doctors at any level (including GPs) increased by around 48,000. Looking just at those in hospitals the number increased by around 41,000.
These figures are looking at the full-time equivalent—or the number of doctors and nurses there would be if you added up all their hours into only full-time roles.
The Tony Blair Institute pointed us toward a Labour party press release as the source of its figures. We’ve asked Labour for more information on how they were calculated.
“Teacher numbers rose by almost 50,000 and support staff by over 200,000.”
This is correct for England. Between 1997 and 2010 the number of full-time equivalent teachers in state schools rose by 48,000 and support staff (including teaching assistants) rose by 230,000.
“By 2010, 76% of English pupils were achieving 5 good GCSEs, compared with 45% in 1997.”
This is correct. In 1996/97, 45% of students in England achieved at least five GCSEs graded A*-C. By 2009/10 this had increased to 76%.
“And the London Challenge programme for London schools, for example, saw the most dramatic improvements in any major capital city anywhere in the world.”
The London Challenge was an investment programme, largely for London secondary schools which ran from 2003 to 2011, and at its peak it had a budget of £40 million a year. At the time the project began, London was identified as having a large number of underperforming secondary schools.
The Institute for Government found that: “The performance of London schools over the decade after London Challenge began improved dramatically, with Key Stage 4 results moving from among the worst in the country to the best during the period.
“By 2010, Ofsted rated 30% of London schools as ‘outstanding’ compared to 17.5% nationally, and very few London secondaries fell into the bottom Ofsted categories.”
We’ve not seen a way to benchmark this performance against every other “major capital city” and have asked the Tony Blair Institute for more information about the claim.
“In 1999 for example, my government agreed a £2 billion investment and settlement for miners suffering from bronchitis and emphysema. By 2005, 350,000 of them had received compensation.”
British Coal was twice taken to the High Court over damage caused to miners through excessive use of vibrating tools and exposure to coal dust. British Coal was found negligent by the court in 1997 and 1998 and as a result the government, which had assumed British Coal’s liabilities in 1994, was instructed by the courts to work with the miners’ lawyers to agree compensation measures.
It’s correct that the Labour government agreeda £2 billion compensation deal with coal miners who contracted lung diseases as a result of their work for British Coal, as well as another compensation pot worth around £500 million for those left injured after using vibrating tools.
For miners suffering from lung diseases, the process involved them submitting a claim of ill health, followed by an assessment of the severity of their case, after which a financial offer may have been made.
A 2005 House of Commons report stated that, as of 9 January 2005, 172,000 claims had been settled in full for miners suffering from chronic obstructive pulmonary disease (COPD), and final offers had been made in another 180,000—a total of around 350,000 cases. Around £1.3 billion had been paid in compensation at that time. In total the government expected payouts to miners for industrial injuries (not only from COPD) to total around £7.5 billion.
“We lifted over a million pensioners out of poverty, over a million children out of poverty.”
The number of pensioners and children living in poverty fell during Labour’s time in office. But the exact level it fell by depends on which measure of poverty you use. We’ve written more about the various ways poverty can be measured here.
The number of pensioners living in relative poverty fell by over a million from 1997/98 to 2009/10, after housing costs have been factored in. If you don’t factor in housing costs, the drop is around 500,000.
But in looking at that same measure—relative poverty—the number of children in poverty did not fall by over a million. The number fell by around 800,000 from 1997/98 to 2009/10, before housing costs are factored in, or by around 300,000 after accounting for housing costs.
If you look at absolute poverty, then the number of children in poverty fell by well over a million (in fact, over two million), regardless of whether you factor in housing costs or not. The same goes for pensioners (almost three million).
It should be noted that the figures do not include Northern Ireland before 2002/03 (after which they are UK-wide), meaning that the level of child and pensioner poverty prior to 2002/03 will be slightly understated.
The Institute for Fiscal Studies describes the fall in pensioner and child poverty during Labour’s time in office as significant, but points out there were other groups did not see the same level of change. For example, relative poverty actually rose among working-age people with no dependent children (from 12% to 14% over the same period). That said, the level of poverty among the UK population as a whole fell under Labour, regardless of which measure you use.
“A report by the respected Institute for Fiscal Studies showed the distributional impact of the tax and benefit changes under that last Labour government. The poorest 10% of households gained by something like 13% in their incomes, whilst the richest 10% lost by almost 9%.”
Mr Blair is correct. As a result of tax and benefit changes under Labour, the poorest 10% of households gained, on average, an amount equal to 12.8% of their income while the richest 10% of households lost an amount equal to about 8.7% of their net incomes.
The chart in the video doesn’t quite match up with what Mr Blair is saying. People with incomes over £100,000 a year are shown separately, and they’re excluded from the “richest” category. If you combine them together to make up the richest 10% of households, it would show a decrease of 8.7%.
“An OECD report on social mobility published last year showed that the UK, during this period, bucked the trend in social mobility in the world’s richest nations, and had the largest fall of any nation in immobility and the biggest rise in social mobility.”
There are various measures of social mobility. Mr Blair is correct in describing what’s happened in the UK when you look at one of those measures.
The Tony Blair Institute told us that Mr Blair was referring to a report by the Organisation for Economic Cooperation and Development (OECD) published last year titled ‘A Broken Social Elevator? How to Promote Social Mobility’.
The report talks about “income persistence”—the likelihood of individuals to move between income groups—and how, compared to the 1990s, the 2010s has seen higher income persistence in numerous Western countries.
In the report, the OECD looked at how likely those working-age people in various income brackets were to still be in those same brackets four years later. Between the late 1990s and early 2010s this likelihood of someone staying in the lowest income quintile decreased from 56% to 45%, the biggest fall among the 16 OECD countries measured.
Similarly, the percentage of people who remained in the poorest quintile after four years fell from 60% in the late 1990s to 40% in the early 2010s.
The OECD says the sharp decline in income persistence in the UK during this time “may partly be explained by the lower unemployment rate and policy reforms introduced in the system of cash-benefits and tax credits during the 1990s and early 2000 (such as the Working Families Tax Credit and the Child Tax Credit), and the introduction of a national minimum wage, in line with a “making work pay” strategy… However, the reduction in low-income persistence has also been accompanied by an increased recurrence of poverty spells in the United Kingdom.”
“Trebling help to the poorest countries … becoming the first major developed nation to hit the 0.7% of GDP aid target.”
It’s correct that the amount of money that the UK spent on development aid roughly tripled in real terms under the last Labour government (that’s accounting for inflation). This followed two decades of it staying relatively flat.
The UN has had a long-standing target that the Official Development Assistance (ODA)—often referred to as foreign aid—provided by a country should total 0.7% of its Gross National Income (GNI). GNI is a country’s annual output of goods and services, plus any income from abroad.
There’s no fixed definition of “major developed nation”, but a number of European countries reached the target of spending 0.7% of GNI on aid before the U.K. did. They were: Denmark, the Netherlands, Sweden, Norway, Luxembourg and Liechtenstein. No G7 or G20 country reached the 0.7% target before the UK.
But that 0.7% target wasn’t met by the UK until 2013, three years after Labour left office. While Mr Blair’s government in particular accelerated the growth of foreign aid spending, it was the Coalition government that both enshrined a commitment to 0.7% of foreign aid spending into law, and was the first to reach that target.
Update 20 June 2019
We've updated this piece with figures on government spending.
Bad information ruins lives. It promotes hate, damages people’s health, and hurts democracy. You deserve better.
Subscribe to weekly email newsletters from Full Fact for updates on politics, immigration, health and more.
Our fact checks are free to read but not to produce, so you will also get occasional emails about fundraising
and other ways you can help. You can unsubscribe at any time. For more information about how we use your data
see our Privacy Policy.