Did bus fares go up or down under Ken Livingstone?
"Don't believe the figures you get from my opponents. Look at, say, an independent - the Independent paper actually. They did an analysis, they concluded that the 8 years I was mayor bus fares in real terms went down 9 per cent, tube fares only went up 1.4 per cent."
Ken Livingstone, BBC News London, 4 January 2012
"In fact official government figures from the Department for Transport show that bus fares rose by roughly 7 per cent during Ken Livingstone's Mayoralty (DfT, Local Bus Fares Index by metropolitan area status and country, October 2010, link). It has also been reported that figures in the Independent were merely Ken Livingstone's own claim as opposed to producing an independent report to verify the claim (Andrew Gilligan, Daily Telegraph, 30 January 2012, link)."
Back Boris Website, 10 April 2012
While the debate about Ken's proposed cut in fares rumbles on both the Ken and Boris campaigns have clashed over each other's records on fares.
The Ken campaign claim that while Ken was in office, between 2000 and 2008, bus fares fell in real terms by nine per cent and that under Boris in real terms bus fares have risen by 18.5 per cent.
The Boris campaign claim that in fact under Ken bus fares rose in real terms by seven per cent.
So which campaign has got their figures right?
Analysis
The figures that Ken mentioned are taken from an analysis produced by the Independent. This did indeed state [in the graphic at the top] that under Ken bus fares fell by nine per cent in real terms. We have contacted the Independent to identify the source of these figures and we will update this factcheck accordingly.
We also contacted the Ken campaign to clarify the source of these and other figures on the campaign website. According to Ken's campaign website in 2008 bus fares were 20 per cent lower in real terms than in 2000. According to the Ken campaign these figures are taken from Transport for London's (TfL) 'Travel in London Report 4'. The relevant graph from the report can be seen below:
![]()
This graph shows trends in public transport fares in real terms. It uses the year 1999/2000 as 100 per cent and every other year's fares are a percentage of this year. The red line represents real bus fares in London and the yellow box shows Ken's time in office.
This graph clearly shows that while Ken was in office there was a drop in real terms in bus fares in London. Ken inherited fare levels from 1999/2000 of 100 per cent and by the end of his time in office, 2007/2008, bus fares had fallen by 20 per cent.
While the graph above does not include the most recent year 2011/12 we can still use it to analyse fares under Boris' time in office. The graph shows that Boris inherited Bus fares of 79 per cent, and by 2010/11 bus fares had risen by four per cent.
The Back Boris campaign has argued that Ken's claims about fares during his time as mayor are not true. To support their assertion they point to statistics on bus fares produced by the Department for Transport (DfT). This graph represents the bus fares for London:
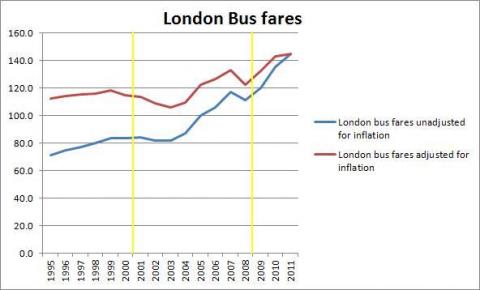
The graph uses unadjusted fares in 2005 as 100 per cent and fares in every other year are a percentage of 2005. The blue line shows London bus fares unadjusted for inflation while the red line shows fares adjusted for inflation. Once again the yellow box shows Ken's time in office.
Based on this graph bus fares rose in real terms by seven per cent under Ken, which supports the Boris campaign's claims.
Ken's campaign have also used figures from the DfT to analyse bus fares under Boris' time in office. They said that under Boris in real terms bus fares had risen by 18.5 per cent, and they provided us with this table:
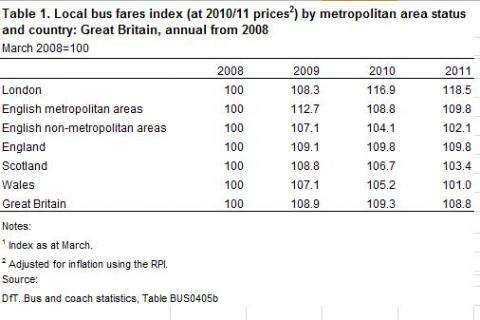
This table uses 2008 as 100 per cent and fares in every subsequent year are a percentage of 2008. This table shows that under Boris bus fares have risen by 18 per cent. This figure is supported by the graph above.
Therefore, based on TfL figures bus fares fell in real terms by 20 per cent during Ken's time in office and then rose by four per cent under Boris. By contrast according to DfT figures bus fares rose in real terms by seven per cent under Ken and 18 per cent under Boris. Both sets of data support Ken's claim that bus fares have risen in real terms under Boris. Both the Ken and Boris campaigns have accurately quoted these figures.
So why is there such a difference between DfT and TfL figures?
We contacted both TfL and DfT to find out.
The Department for Transport directed us to this document which explains that the bus fares index is calculated based on information provided by around 80 of the largest bus companies in England and Wales and is based on operators' gross receipts. The index does not take account of reimbursements provided by local authorities for concessionary travel. This means that concessionary fares are in effect a fare reduction that the DfT bus fares index does not take account of.
Transport for London also said that DfT's index does not take account of commuters switching to cheaper tickets, which offsets the effects of fare increases. Taken together this could explain why one set of figures show a real term increase in fares and one shows a real term decrease.
As DfT figures do not take account of concessionary fares it can be said that TfL's figures are a better representation of the cost of bus travel for London commuters.
As Ken's campaign have based their claims regarding bus fares during his term in office on TfL figures they are a better representation of the cost of tickets to Londoners during this time than the DfT figures used by the Boris campaign.
However, since both TfL and DfT figures cover a similar time frame we cannot see why Ken's campaign have decided to use the TfL figures when analysing bus fares under Ken but Dft figures when looking at bus fares under Boris.
Conclusion
Ken Livingstone's figures, sourced from TfL, are accurate, although we cannot explain why he used these to analyse fares during his time in office but DfT figures to analyse fares under Boris Johnson.
Boris' campaign are accurate in the figures they use from the DfT, however these are not particularly useful as they do not take into account concessions or reimbursements provided by local authorities. So for now, we can reliably say that bus fares for commuters did drop under Ken Livingstone's first term, but have been broadly rising ever since.