What was claimed
UKHSA graphs on X depicting hospital admissions for Covid-19, flu and RSV contain data from 2023-24.
Our verdict
They do not. The UKHSA posted these graphs as an illustration of its data dashboard, based on no actual data.
What was claimed
UKHSA graphs on X depicting hospital admissions for Covid-19, flu and RSV contain data from 2023-24.
Our verdict
They do not. The UKHSA posted these graphs as an illustration of its data dashboard, based on no actual data.
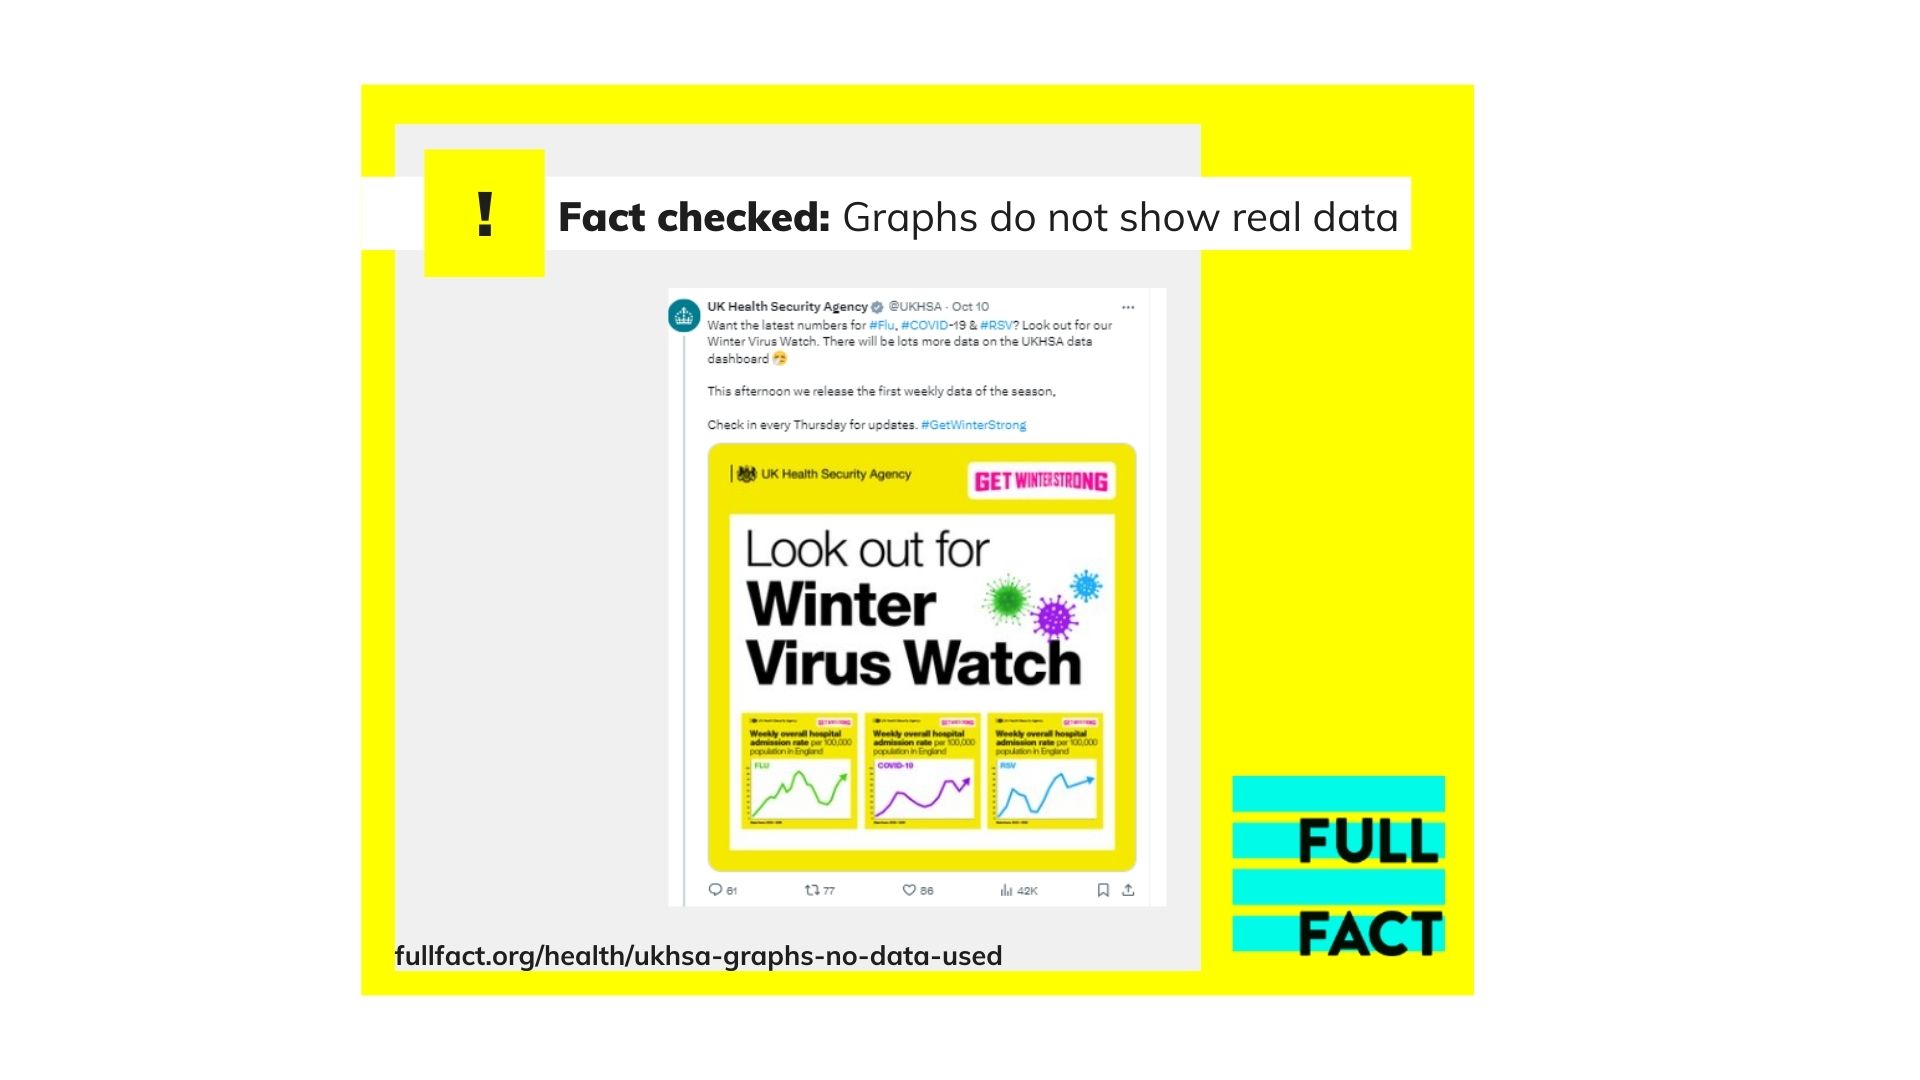
The UK Health Security Agency (UKHSA) has included several graphs depicting hospital admission rates for Covid-19, flu and respiratory syncytial virus (RSV) in a now deleted post on X (formerly Twitter). But the problem is that these aren’t actually based on any real data.
The graphs were contained within a graphic posted on 10 October promoting their “Winter Virus Watch” and the release of more data on the UKHSA data dashboard that afternoon.
The UKHSA framed these graphs as representing data from “2023-2024”, however this isn’t the case.
Only after X users later highlighted that the graphs depicted do not reflect genuine trends for this period did the UKHSA acknowledge in a separate post (which has also now been deleted) that the graphs are “not based on data”.
Join 73,000 newsletter subscribers who trust us to check the facts
Sign up to get weekly updates on politics, immigration, health and more.
Subscribe to weekly email newsletters from Full Fact for updates on politics, immigration, health and more. Our fact checks are free to read but not to produce, so you will also get occasional emails about fundraising and other ways you can help. You can unsubscribe at any time. For more information about how we use your data see our Privacy Policy.
Instead, they are simply “indicative of what they will look like once published”, it said.
Had the graphics included the real data for Covid-19, flu and RSV over 2023/24 and the most recent figures for 2024-25 they would have looked something like this:
X user “Cat in the Hat” told Full Fact: “In fact the charts for 2023/24 won’t look anything like this when published because, apart from a very brief period in the middle of winter, there has been virtually no flu or RSV across the rest of the year, whereas Covid cases have remained at high levels across the year.”
Producers of official information should produce analytical outputs that are high quality, useful for supporting decisions, and well respected.
Following our email to the UKHSA the post on X was deleted.
The UKHSA said: “The graphs were intended as an example of the type of information we will be releasing weekly in our Winter Briefings. The graphs were not based on real data and we appreciate this could be misleading so we have removed the post.”
Update 14 October 2024
This article was updated to include a statement from the UKHSA.
Full Fact fights for good, reliable information in the media, online, and in politics.
Bad information ruins lives. It promotes hate, damages people’s health, and hurts democracy. You deserve better.
Subscribe to weekly email newsletters from Full Fact for updates on politics, immigration, health and more. Our fact checks are free to read but not to produce, so you will also get occasional emails about fundraising and other ways you can help. You can unsubscribe at any time. For more information about how we use your data see our Privacy Policy.