Naked graphs #8
Over the festive break, we'll be publishing highly graphic content. That's right: graphs, naked. We're very particular about labeling our graphs carefully so readers know what's going on. So for a change, we'll be featuring a graph each day with a few important features missing. See if you can work out what they're showing.
Clue: they're all based in the UK or some of its countries and cover one of our five core areas: Economy, Immigration, Health, Education and Crime.
Today is graph #8, and not a line chart for a change. Probably our toughest yet:
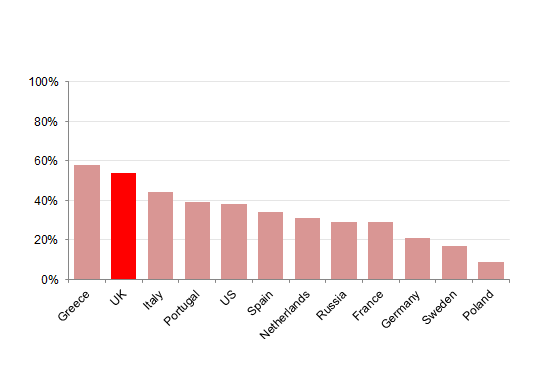
Comment on our Facebook page. Answer will be in tomorrow's article. Good luck!
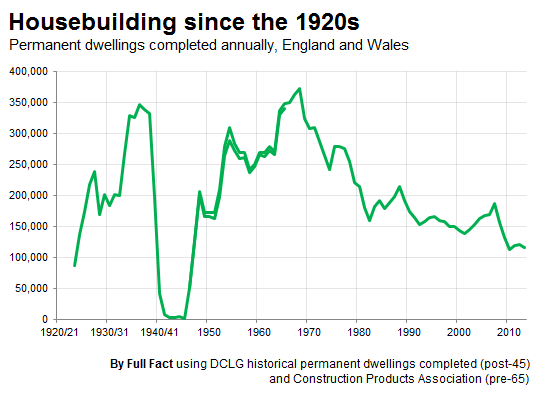
The answer to yesterday's puzzle was housebuilding since the 1920s in England and Wales (figures for the whole of the UK don't go back that far). Figures from the Department for Communities and Local Government and earlier numbers supplied to us from the Construction Products Association.