Prime Minister's Questions, factchecked
Join 73,000 newsletter subscribers who trust us to check the facts
Sign up to get weekly updates on politics, immigration, health and more.
Subscribe to weekly email newsletters from Full Fact for updates on politics, immigration, health and more. Our fact checks are free to read but not to produce, so you will also get occasional emails about fundraising and other ways you can help. You can unsubscribe at any time. For more information about how we use your data see our Privacy Policy.
“[Jeremy Corbyn] failed to mention the automatic pay increases over and above the 1% that many public sector workers get.
“Indeed, a calculation suggests that a new police officer in 2010, thanks to progression pay and annual basic salary increases, and the increase in the personal allowance that is a tax cut for people, have actually seen an increase in their pay of over £9,000 since 2010, a real terms increase of 32%.”
Theresa May, 13 September 2017
The calculation looks about right, but we’ve been told this isn’t likely to be representative of the experience most police officers have had.
Figures we were shown by the Police Federation—the staff association for rank-and-file police officers in England and Wales—suggest only a minority of officers may have seen this kind of pay increase. They also indicate that overall police pay has fallen in real terms since 2010.
This data isn’t publicly available, so we haven’t yet been able to verify it.
Downing Street’s maths
The calculation leading to the 32% figure appears to come from Downing Street itself, with a source from Number 10 explaining this afternoon how the figures were reached.
A new police officer starting service in September 2010 would have been paid £23,259 on the lowest pay point. When you take off income tax and national insurance contributions from that, you get to just under £18,000 take-home pay.
All police officers move up a salary scale, usually automatically after each year’s service. That same officer, if still in post, would now be earning around £35,478, according to Downing Street (the published figures are slightly different, but similar).
Again, after tax, that looks more like £27,400 to take home today. This tax, Number 10 is keen to stress, is made less than it would otherwise have been by the government’s increases to the income tax personal allowance since 2010.
That change from £18,000 to £27,400 is the £9,000 Theresa May is talking about, and that amounts to a roughly 33% increase when you factor in price inflation.
So we can’t fault the maths, but the context is another matter.
Not the experience of most officers?
We already know that police officer numbers have fallen significantly since 2010, so it’s unclear how representative this example officer’s experience has been.
The Police Federation was scathing in its own remarks shortly after the Prime Minister made her claim.
It told us that Mrs May’s comments weren’t representative of the experience of most officers. Instead it offered an alternative: the total pay of officers has fallen by 16% in real terms (counting inflation) when comparing 2009/10 with the same pay in 2015/16.
According to the Federation, more than half of police officers are already at the top of the pay scale—so don’t benefit from further pay progression.
The figures they quoted to us come from a census of police hours and pay, which isn’t publicly available. So, for now, we can’t verify the claims for certain.
“Household savings are lower than at any time in the last 50 years”
Jeremy Corbyn, 13 September 2017
As a percentage of households’ take-home pay, this is correct.
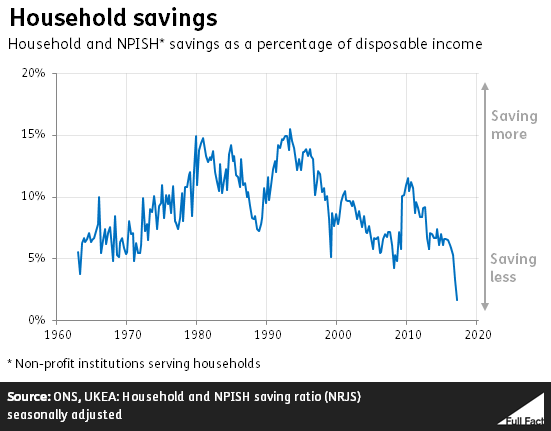
This was widely reported in the summer, when the latest figures were released by the Office for National Statistics. The average saving ratio in January to March 2017 was estimated at 1.7%—the lowest ratio since records began in 1963.
Savings here refers to how much of your income you put aside in savings, plus whatever you don’t happen to spend from the rest of your income. So it’s about how much money you end up with at the end of the month once you’ve paid your bills, gone to the cinema etc. as a proportion of how much money you had coming in to start with.
A fall in this number means that, on average, households aren’t saving as much as they used to, and are spending more of the money they get.
Why aren’t we saving?
The ONS points to increased consumption, increasing prices and lower wage growth to answer this. It adds that while the saving ratio is often volatile, “the underlying trend is downwards”.
For any given household, low savings doesn’t necessarily mean the household is in in a bad way economically. For example, a household might not be too concerned about saving if it had some certainty about its future income.
How useful are these figures?
There are limits to what these figures can tell us.
For one, the saving ratio is an average—many households will be saving more than 1.7% of their income and many will be saving less or even spending more than they earn, racking up debt.
The figures also include savings from non-profit institutions serving households (NPISH), such as charities and universities, which you wouldn’t necessarily assume given what it’s called. The figures are likely to differ if you take these out of the picture.
In future, the ONS intends to report household and NPISH data separately, and introduce a number of other methodological changes.
“Over the time that we have been in government we have been seeing more disabled people get into the workplace”
Theresa May, 13 September 2017
This is correct.
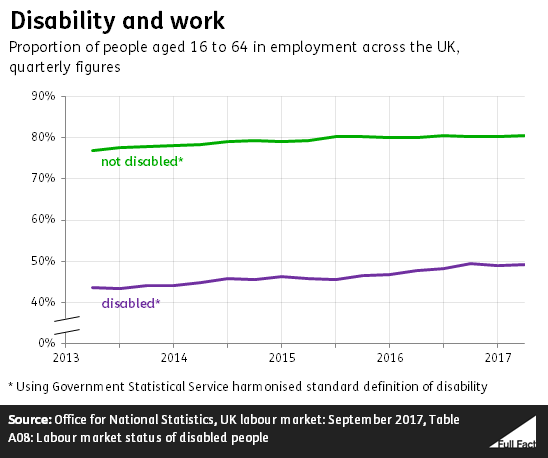
The number of disabled people in work—aged between 16 and 64—has risen from 2.9 million in 2013 to 3.5 million this summer. The employment rate has also increased over that period from 44% to 49%. In other words, just under half of disabled people aged 16-64 are now in work.
2013 is the earliest comparable data we have. It’s still correct comparing with May 2015 (when the Conservative party won a majority) and July 2016 (when Theresa May became Prime Minister).
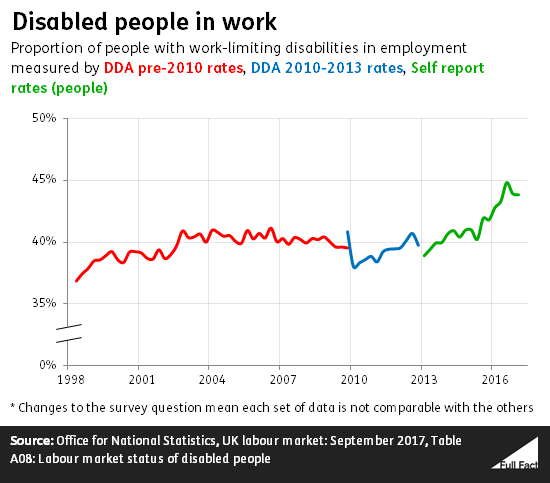
A person is counted as disabled if they have a health condition lasting or expected to last a year or more that limits their ability to carry out day-to-day activities.
Over the same period the number of non-disabled people in work also increased but by a smaller proportion, from 25.8 million to 27.2 million. The employment rate for non-disabled people increased from 77% to 81%.
These numbers show us a net increase. They can’t tell us exactly how many people have entered the workplace or left it.
There are older figures than 2013, but these aren’t comparable to the latest set. In the older data, disabled means the person has a long term health condition which affects the amount or type of work they can do. The way people were asked about this changed at various points over the last decade.