BBC Question Time, factchecked
Question Time this week was in Croydon. On the panel were Education Secretary Justine Greening, Labour MP for Walthamstow Stella Creasy, TV presenter Kirstie Allsopp, Spectator columnist Charles Moore, and Guardian columnist Aditya Chakrabortty.
Join 72,953 people who trust us to check the facts
Sign up to get weekly updates on politics, immigration, health and more.
Subscribe to weekly email newsletters from Full Fact for updates on politics, immigration, health and more. Our fact checks are free to read but not to produce, so you will also get occasional emails about fundraising and other ways you can help. You can unsubscribe at any time. For more information about how we use your data see our Privacy Policy.
“I talk to police officers in London desperately worried about the fact we're losing 3,000 officers from our streets.”
Stella Creasy MP, 9 November 2017
The Metropolitan Police expects it could lose around 3,000 police officers by 2020, according to Cressida Dick, Commissioner of the Metropolitan Police.
Commissioner Dick told a committee of MPs that the Met Police expects to have to make savings of £400 million between now and 2020. She said that this was the Met’s current “planning assumption” and relied on projections for things like inflation, the exchange rate and pay settlements remaining the same over the next few years.
This scenario would lead to police officer numbers in the Met falling to “between 27,500 and 28,000”, from the current level of “over 30,000”. Commissioner Dick then confirmed that she expected numbers to fall by around 3,000.
The latest available data puts the number of Met police officers available for duty at 30,000 at the end of March 2017. This is the full-time equivalent figure, meaning that two officers working half a week each would count as one full-time equivalent officer.
Although there are 32,000 full-time equivalent police officers in the Met altogether, some are “long-term absentees” and so not available for duty.
Across England and Wales the number of police officers overall has been declining since 2010.
“Most people who own a house, which is the majority of the population, own one house.”
Charles Moore, 9 November 2017
This is basically right. The majority of households in the UK own their home, as opposed to renting. Households in the UK had 2.4 people on average in 2016. Most owner-occupiers in England only have one house.
63% of English households own the home they live in, which may be a house or a flat. The last time the proportion was lower than this was in 1985. The number of owner-occupiers has been broadly the same since 2012/13.
The latest data on second home ownership in England is from 2013/14. 2.3 million households report having a second property, while 674,000 had a “second home” (meaning they mainly used it as a holiday home or let it out to others). Second homes data will be collected again in the 2017-18 survey.
That would mean most English owner-occupiers only have one home.
In Scotland, 61% of households own the home they live in. And for Northern Ireland, it is 66%. We haven’t been able yet to source this data for Wales, or second home data outside of England.
We've got more people in work than we've had for many years and an unemployment rate that's about half of the Eurozone average.
Justine Greening, 9 November 2017
This is correct on both counts. The number of people in employment is at a near record level at 32 million, as is the employment rate at 75%. We’ve looked more into what kinds of jobs those are before.
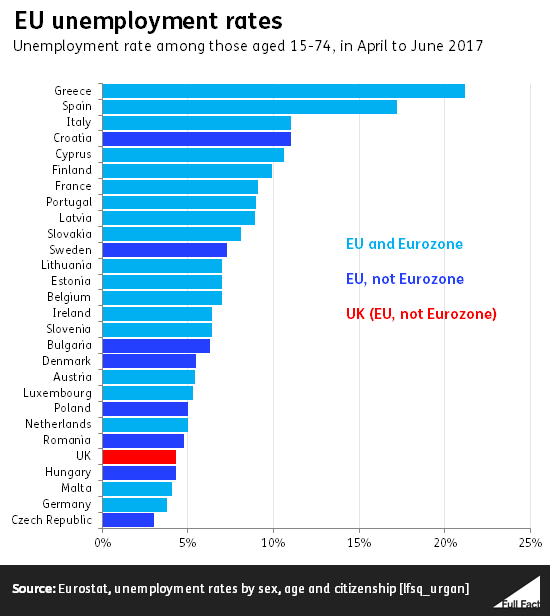
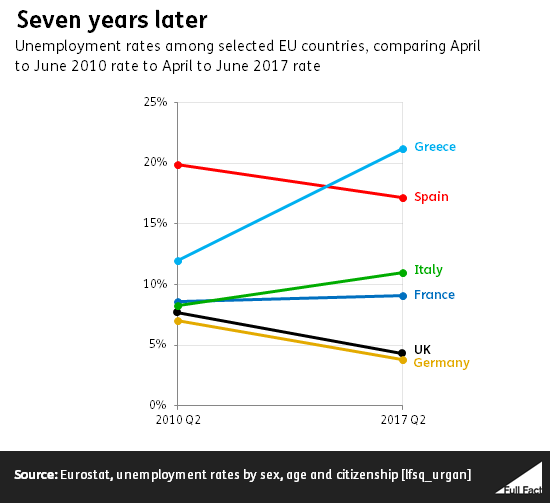
The UK unemployment rate in April to June this year—the latest period we have comparable EU figures for—was 4.3%. That’s just under half of the Eurozone average of 9%. These figures cover people aged between 15 and 74.

The unemployment rate is the number of unemployed people as a percentage of all ‘economically active’ people. ‘Economically active’ means people who are either in work or who want to be. So it doesn’t count people who aren’t in work, but aren’t actively seeking it either, like retirees.
The Eurozone is made up of EU countries which use the Euro. It includes Austria, Belgium, Cyprus, Estonia, Finland, France, Germany, Greece, Ireland, Italy, Latvia, Lithuania, Luxembourg, Malta, Netherlands, Portugal, Slovakia, Slovenia and Spain.
The UK has been doing much better in recent years compared to the Eurozone average than it has done for decades. The UK has always had a lower unemployment rate, coming closest in autumn 2011 when the UK rate hit 8.5%, with the Eurozone at 9.8%. Latvia and Lithuania weren’t part of the Eurozone back then.
Some countries with the Euro still have slightly lower rates. Germany, for example, has had a consistently lower rate than the UK since the 2009 recession.

They've [the government] said that they will fix the economy. Actually, they've tanked it so badly that we're going for the biggest squeeze on our living standards since the Napoleonic Wars.
Aditya Chakrabortty, 9 November 2017
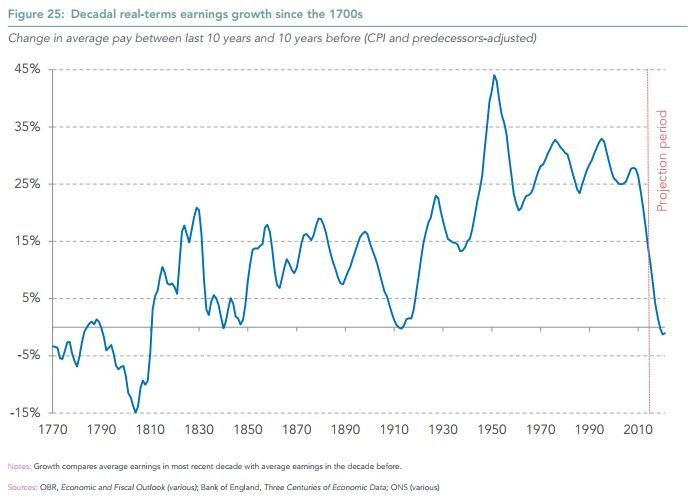
Wage growth between 2010 and 2020 will be the lowest it’s been over any ten year period in peacetime since the Napoleonic Wars. Experts say it was lower around both the First and Second World Wars.
There's no single measure of living standards. Different measures look at different groups of people, different income sources and adjust for inflation in different ways. Looking at what’s happened to wages is just one way of measuring it and doesn’t always give us the full picture. For example, people can sustain their living standards after a fall in income if they run down their savings.
Lowest wage growth since the Napoleonic Wars?
This seems to be based on a claim made by the think tank the Resolution Foundation back in March. It said that “Britain is set for a return to falling real pay later this year, with this decade now set to be the worst for pay growth since the Napoleonic wars [from around 1803 until 1815].”
Following the government’s budget in March both the Resolution Foundation and the Institute for Fiscal Studies concluded that wages in 2022 won’t be any higher than they were before the financial crisis in 2007, based on current forecasts.
The analysis by the Resolution Foundation is based on forecasts for wage growth and inflation in the next five years from the Office for Budget Responsibility. This is combined with figures from the Office for National Statistics and the Bank of England on how earnings have grown in real terms over the past 210 years.
The Foundation found that “we are on course for average pay across the decade to 2020 to be lower than the average for the decade before. That would represent the worst decade for real earnings growth in 210 years.”

BBC Reality Check have also looked at a similar claim. They spoke to a visiting professor in the London School of Economics’ department of economic history, Greg Clark, who said the claim was correct if you look at whole decades like the 1970s or 80s. But if you look at any ten year period then real wages declined more between 1907 and 1917, and between 1935 and 1945. Right around the time of the First and Second World Wars.
So looked at that way, the current period of wage growth is the lowest in peacetime since the Napoleonic Wars.
Overall average wages have largely increased since the early 1800s, once you take inflation into account, with a noticeable decline over the last ten years.
The historical figures for earnings published by the Bank of England aren’t National Statistics—with the level of scrutiny and accuracy given to the more recent figures published by the UK Statistics Authority. The Bank describes them as “best endeavours”, mainly for use by academics.