BBC Question Time: Recap and Factcheck
Question Time this week in London’s Canary Wharf was a ferocious factory of claims, fitting for the most productive local area in the country (in £ per hour worked).
Topics covered were austerity, immigration, knife crime and news that students in Manchester have voted to replace clapping with the British Sign Language alternative at some of their events.
On the panel this week were justice secretary David Gauke, shadow foreign secretary Emily Thornberry, businessman and Apprentice star Claude Littner, spoken word artist and activist George Mpanga (George the Poet), and the journalist Isabel Oakeshott.
Obscure fact about Canary Wharf tangentially related to politics: the Social Democratic Party was born just down the road 37 years ago, when four Labour MPs chose to leave the party and found a new movement. They would later merge with the Liberal party to form the Liberal Democrats.
Join 74,000 newsletter subscribers who trust us to check the facts
Sign up to get weekly updates on politics, immigration, health and more.
Subscribe to weekly email newsletters from Full Fact for updates on politics, immigration, health and more. Our fact checks are free to read but not to produce, so you will also get occasional emails about fundraising and other ways you can help. You can unsubscribe at any time. For more information about how we use your data see our Privacy Policy.
Question 1: The end of austerity?
The programme kicked off with a wide-ranging question about Theresa May’s conference speech this week, asking whether she was right to say the end of austerity was in sight.
Let’s remind ourselves of what Mrs May said in that speech:
“When we've secured a good Brexit deal for Britain, at the Spending Review next year we will set out our approach for the future. Debt as a share of the economy will continue to go down, support for public services will go up. Because, a decade after the financial crash, people need to know that the austerity it led to is over and that their hard work has paid off.”
This spawned a lot of discussion, so time for some subheadings:
Deficit down, debt up
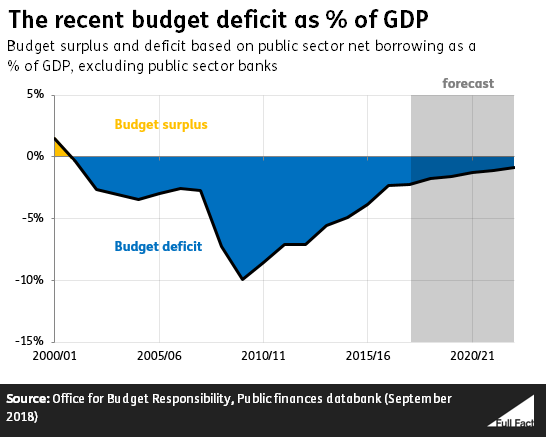
David Gauke began by talking about the deficit—the difference between what the government spends and what it gets in a year. He claimed that “we have succeeded in bringing the deficit down very substantially. In 2010 it was 10% of GDP… it is now at 2%”.
It’s correct that public sector net borrowing, the widest measure of the deficit, was 10% of GDP in 2009/10 and had fallen to around 2% by 2017/18. In monetary terms the deficit has reduced from £174 billion (in 2017/18 prices) to around £40 billion.
Mr Gauke then said “we have still got a high level of debt.”
The debt is the total amount owed by the government. In 2009/10 the debt made up around 64% of GDP, in 2017/18 that figure was 85%. That’s an increase from the equivalent of £1.2 trillion (in 2017/18 prices) to £1.8 trillion.
Hitting the poorest hardest?
George the Poet countered Mr Gauke’s figures with a different perspective: “The hardest hit by austerity have obviously been the most vulnerable in society”
Poorer households have been more negatively affected by tax and benefit changes since 2010. But their incomes have also increased the most on average since 2010—by 12% in real terms between 2010/11 and 2016/17.
That’s because the incomes of the poorest households have, on average, increased far more since 2010 than the negative impact of increased taxes and reduced benefits.
Crucially, though, many of the tax and benefit changes expected to affect poorer households, like Universal Credit, haven’t been fully implemented yet.
We’ve written more in a full factcheck.
Following on from that were a series of claims about the impacts of austerity from George the Poet: “Half a million people a year on food banks.” and “Since [2010] I think homelessness alone has doubled, more than doubled in the intervening period”
We don’t know for certain how many people use food banks. The largest food bank network in the UK, the Trussell Trust, estimated that around 666,000 different people used its food banks in 2017/18. In that year the Trust handed out 1.3 million food parcels.
A 2014 estimate suggested that the Trussell Trust’s food banks account for around half of the 800 food banks in the UK at the time, so the total number of people using food banks could be much higher still than 666,000.
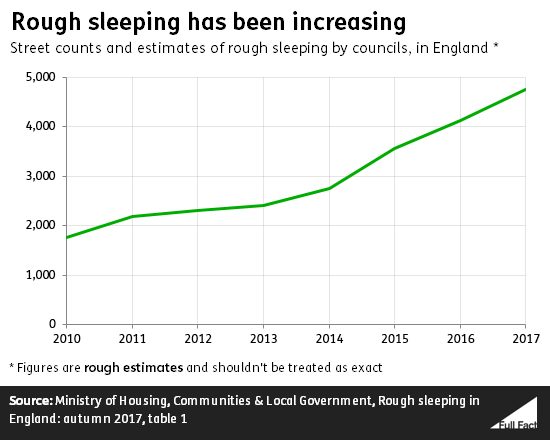
As for homelessness, the claim is correct looking at rough sleepers in England rather than all homeless people. Since 2010 the number of recorded rough sleepers has almost tripled, but these figures are very rough estimates.
In England the number of people sleeping rough is a snapshot taken in autumn each year. Most councils count or estimate the number of people sleeping rough in their area by talking to local agencies.
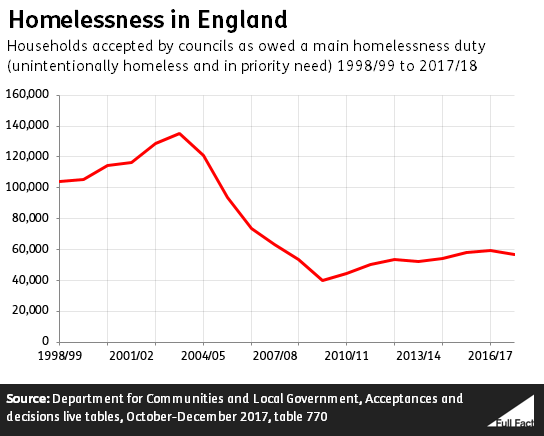
Since 2009/10 the number of households accepted by councils as homeless and entitled to be housed has increased from around 40,000 in England to just under 57,000 in 2017/18. That’s an increase of about 40%. We’ve written more about the definition of homelessness in England and when councils have to rehouse people here.
Employment up, but what kinds of jobs?
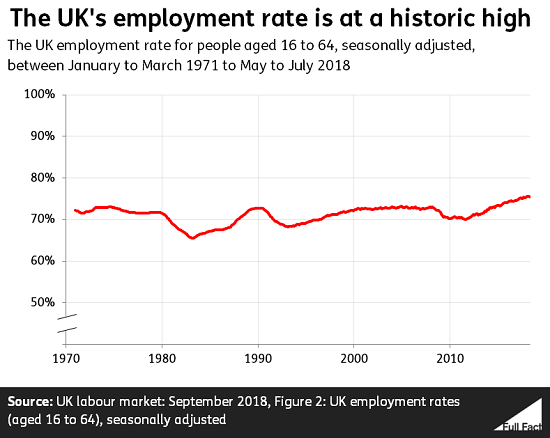
Isabel Oakeshott swung the discussion back towards what she saw as some of the positives over the past few years, saying “employment is at an absolute record high”.
That’s right. The latest figures show that for May to July 2018 there were 32.4 million people in work in the UK. This has generally been on the increase since 1971 (when comparable records began) as the population has increased. The employment rate—a better measure for judging trends over time—was at 75.5% earlier this year, very close to record levels as well.
But one audience member wasn’t impressed: “look at the kind of jobs that have actually been created, there’s five million gig workers”.
There aren’t any official figures for how many people are working as part of the gig economy, although there have been estimates. Last year, the Institute for Fiscal Studies (IFS) said the modern gig economy was “hard to spot in the data” and that it wasn’t designed to capture it.
The five million figure likely comes from 2016 research, when polling group Ipsos Mori interviewed an online sample of 2,238 people aged between 16 and 75 across the UK. 11% of respondents said they had successfully managed to find work via “sharing economy platforms such as Upwork, Uber or Handy” during the past year. The researchers equated that to around 4.9 million people.
Other estimates are lower. Research by the Department for Business, Energy and Industrial Strategy, used an online survey of 2,184 adults in Great Britain conducted by the social research agency NatCen.
From that survey, NatCen estimated that 4.4% of people had worked in the gig economy in the year to July/August 2017, which is “roughly” 2.8 million people. That’s higher than previous estimates which suggested around a million people worked in the gig economy.
Question 2: Reducing immigration
After a grand tour of the economy, matters turned to immigration. An audience member asked what the real reason for reducing immigration was, given the UK’s low unemployment rate.
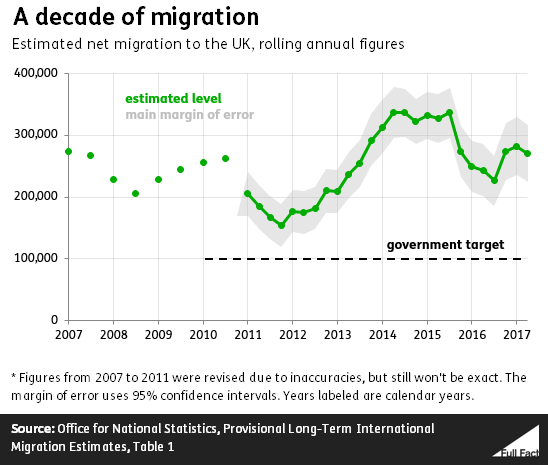
In the past, the government has repeatedly committed to reducing net migration to below 100,000 a year, and has never looked likely to achieve this target.
A recent report by the independent Migration Advisory Committee (MAC) recommended that if we were to effectively start from a blank slate on immigration policy after Brexit, there should be no preferential access for EU citizens over those from outside the EU. That’s on the assumption that any Brexit agreement the UK reaches with the EU doesn’t cover a future immigration system.
Among the most significant of the recommendations was that there should be fewer low-skilled routes for people to come to the UK “with the possible exception of seasonal agricultural workers schemes”. Instead, existing routes should open up to more “moderately skilled” workers.
Isabel Oakeshott started by criticising the failure to control levels of immigration into the UK, focusing on the numbers over the last 15 years. “Around 300,000 people every year coming in, that is nearly one million people every few years, adding to this population.”
George Mpanga hit back, initially saying she wasn’t counting people who emigrate abroad —“you didn’t talk about net migration”—but rightly rowed back from that after Ms Oakeshott clarified her claim did actually include that.
Net migration counts people coming in and subtracts people who emigrate abroad. Ms Oakeshott’s figures for this are correct for recent years, but estimated net migration hasn’t been consistently as high as 300,000 a year for very long.
Following the accession of mainly central European countries into the EU in 2004, overall net migration to the UK rose from typical levels of 150,000 a year to over 260,000 a year. It peaked at estimated levels over 300,000 in 2014 and 2015, and has since fallen back to around 270,000 in 2017/18.
Net migration has also been a big driver of population growth ever since the turn of the millenium, it added more to the population than births (minus deaths) in all but two years since 1998.
How racist is the UK?
During the discussion of immigration rules, the conversation turned towards questions of xenophobia and racism in British society, with an audience member saying:
“George [the poet], have you actually looked at the numbers? The UK is one of the least racist societies actually across Europe.”
We don’t know what research he was referring to here. It’s possible the claim refers to a 2013 world values survey finding that British people were among the least likely to select “people of another race” as someone they wouldn’t want as a neighbour.
But this tells us very little about racism in the UK. The data is five years old and it’s unlikely that all people who do hold racial prejudices would be willing to divulge them in an interview. And crucially, racism is something that is experienced by individuals, much of which may be missed by statistical surveys.
International comparisons will not help someone who has to confront it in their daily life in the UK. You wouldn’t tell someone who had lost a loved one to homicide that Britain has some of the lowest homicide levels in the world.
Question 3: Knife crime
Knife crime was up next, with an audience member asking whether the government was doing enough to tackle rising knife crime among young people specifically.
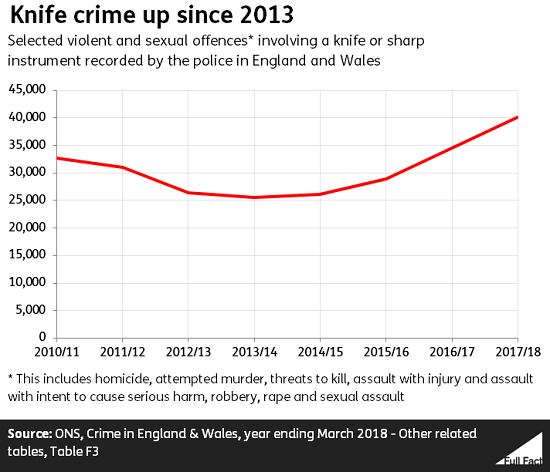
David Dimbleby kicked off with “[knife crime rose by] 22% England and Wales in 2017.”
It’s correct that police in England and Wales recorded a 22% increase in knife crime between 2016 and 2017. Knife crime fell from 2010 to 2013 but has since risen each year.
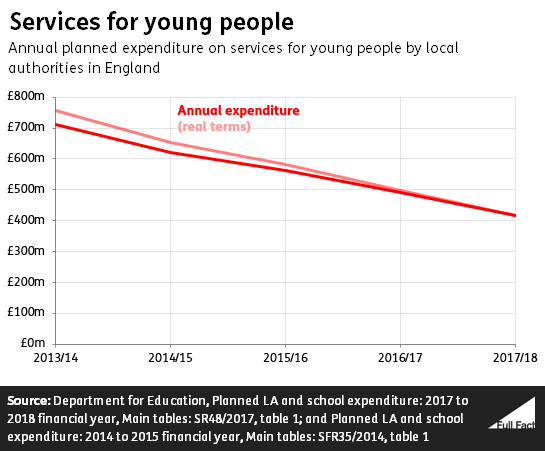
Emily Thornberry then claimed “[local authorities] will, because they’re going bankrupt, cut back on youth services, and frankly, we see the result of that.”
Spending on youth services by councils in England has fallen significantly over time. Local authorities are planning to spend around £416 million on youth services in 2017/18—a spending reduction of 16% compared to the planned spend for the year before (in real terms). Looking back to 2013/14 (when planned spending on youth services was around £756 ,million in 2017/18 prices), that’s a spending reduction of 45% in real terms.
Youth services include youth work and activities for young people aged 13-19, as well as services to support young people’s participation in education and training, substance abuse services, and teenage pregnancy services.
The youth services budget is part of a broader budget for children and young people, which includes things like Sure Start, fostering and other services for looking after children, and family support services. The planned budget for that has also been falling in real terms: by 6% from 2013/14 to 2017/18.
Question 4: Hand waving instead of clapping
With minutes left on the clock, the panelists discussed whether Manchester Students’ Union was right in a recent decision to ask people at some of its events to use the British Sign Language alternative to clapping. The Students’ Union itself has released a statement clarifying what the policy involves and why it came about.
“It’s just ridiculous”, according to Claude Littner, while George Mpanga argued “I’m mindful that people are different and it’s not fair to just laugh down difference”.
We’re going to side with David Dimbleby on this one: “Our time’s up, so we have to stop”.
Correction 16 August 2019
An earlier version of this article reported planned spending on youth services in the thousands, this should have been in the millions. We have also updated the section on youth services so that all figures relate to planned spending.