Local election bar charts revisited: how misleading were they in the end?
During the recent English local elections campaign, we wrote about several leaflets from the main parties that used misleading, unsourced or otherwise unreliable bar charts to support claims about the state of the contest in their area.
So, now that the election is over, how do those bar charts compare with the actual results?
Obviously the bar charts in the leaflets weren’t necessarily predictions. Many were clearly labelled to say they showed polls, or the results of other contests. And of course the leaflets themselves, or other factors, may have affected what happened.
But when it comes to giving voters an idea of how things stood, some of what they said was clearly wide of the mark.
The comparisons below show the vote counts for the area the leaflets appear to refer to—whether these are single wards or larger areas.
Join 74,000 newsletter subscribers who trust us to check the facts
Sign up to get weekly updates on politics, immigration, health and more.
Subscribe to weekly email newsletters from Full Fact for updates on politics, immigration, health and more. Our fact checks are free to read but not to produce, so you will also get occasional emails about fundraising and other ways you can help. You can unsubscribe at any time. For more information about how we use your data see our Privacy Policy.
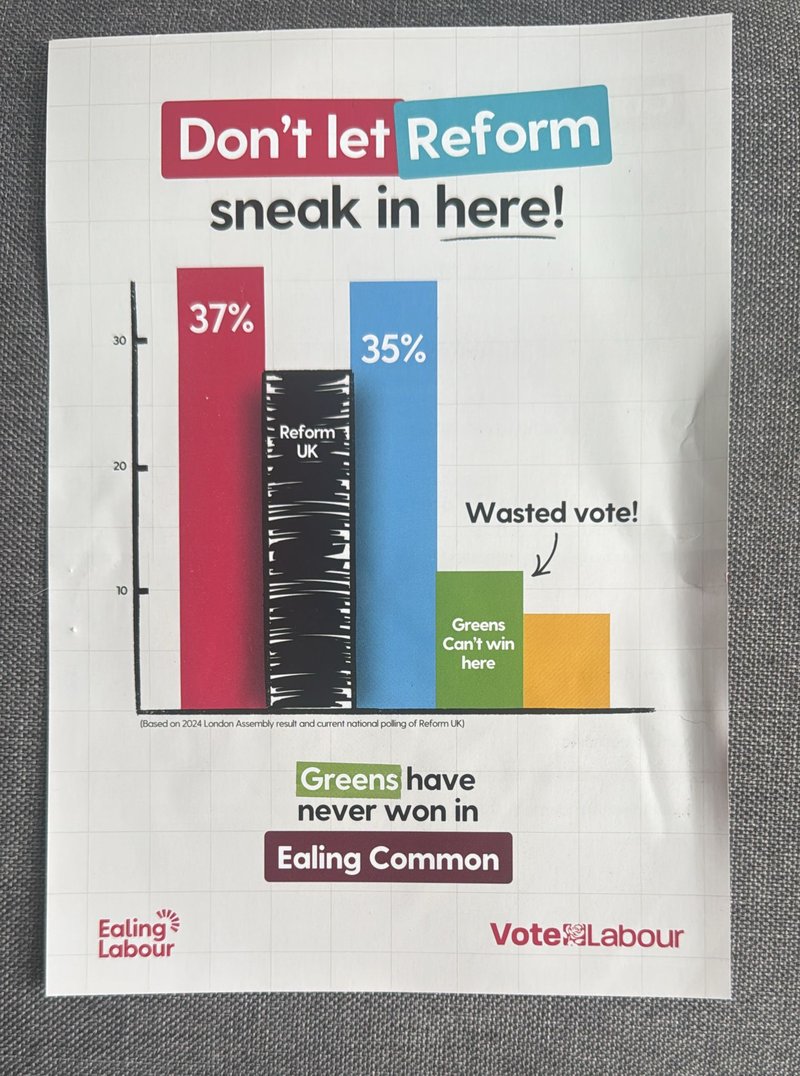
Maybe it was true that votes for the Green Party in Ealing Common were “wasted”, even though they came second overall. But votes for the Liberal Democrats certainly weren’t. They won all three seats in this ward. As to the danger of Reform UK “sneaking in”... they came last.
Green Party in Gateshead
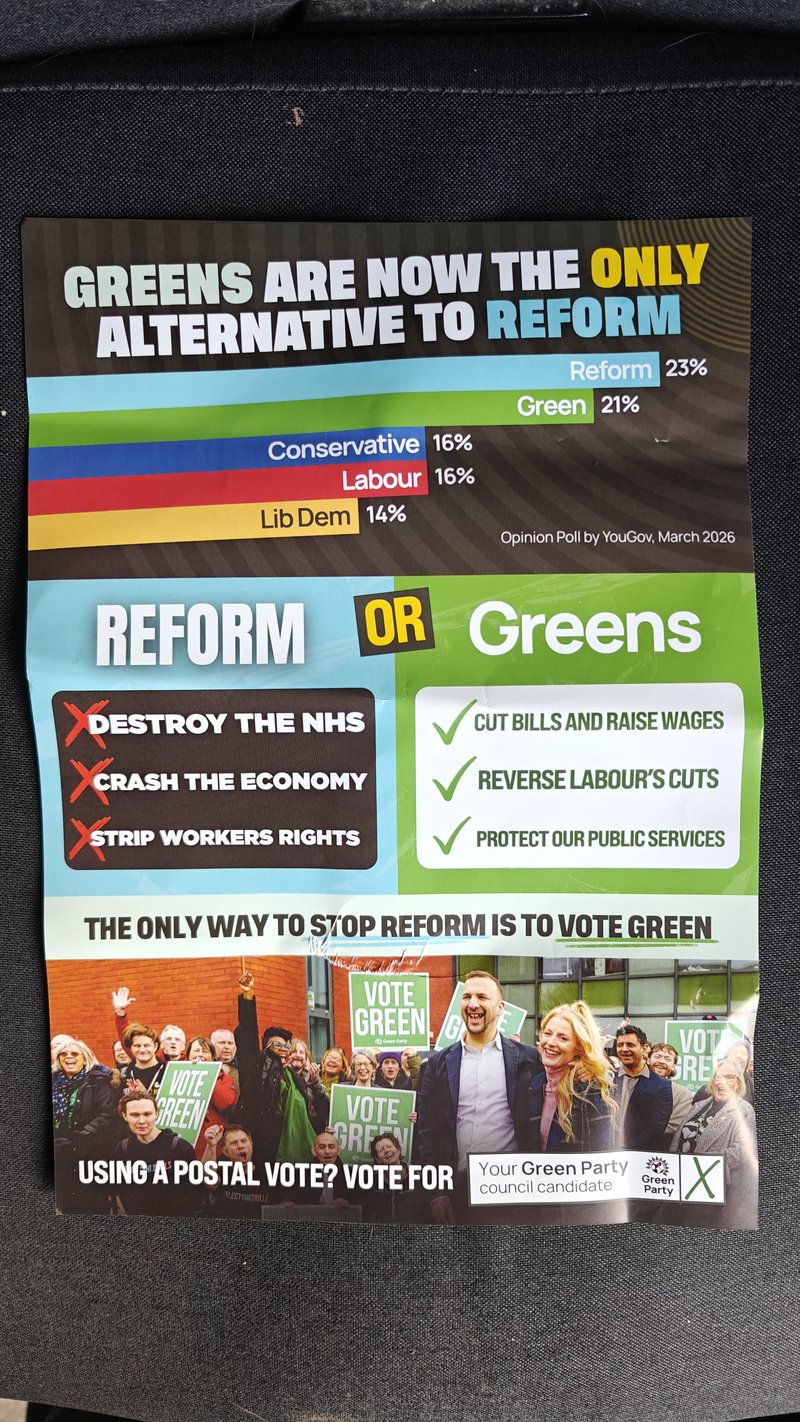
Reform did win control of Gateshead Council with 38 seats, so in that respect the Greens’ bar chart was right to show them as the front-runners. The Greens themselves were clearly not the “only alternative” as it turned out, however. They finished fourth in votes overall. And although they won three seats, the Liberal Democrats won 13 and Labour won 12.
Conservative Party in Haslemere
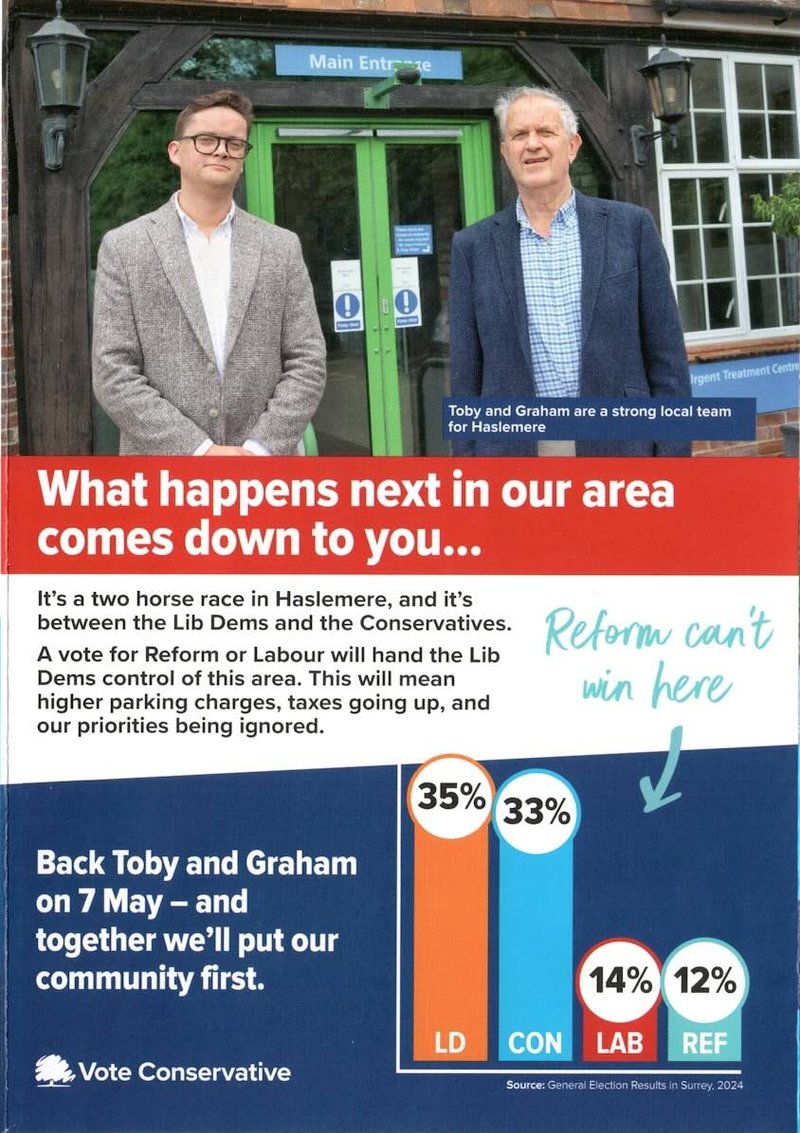
The Lib Dems and the Conservatives did finish first and second on vote share in Haslemere, with the Lib Dems taking both seats. Perhaps if all the votes for Reform candidates had gone to Conservatives instead, they might have picked up one seat—but of course Reform themselves could say the same.
Reform UK in Chelmsford
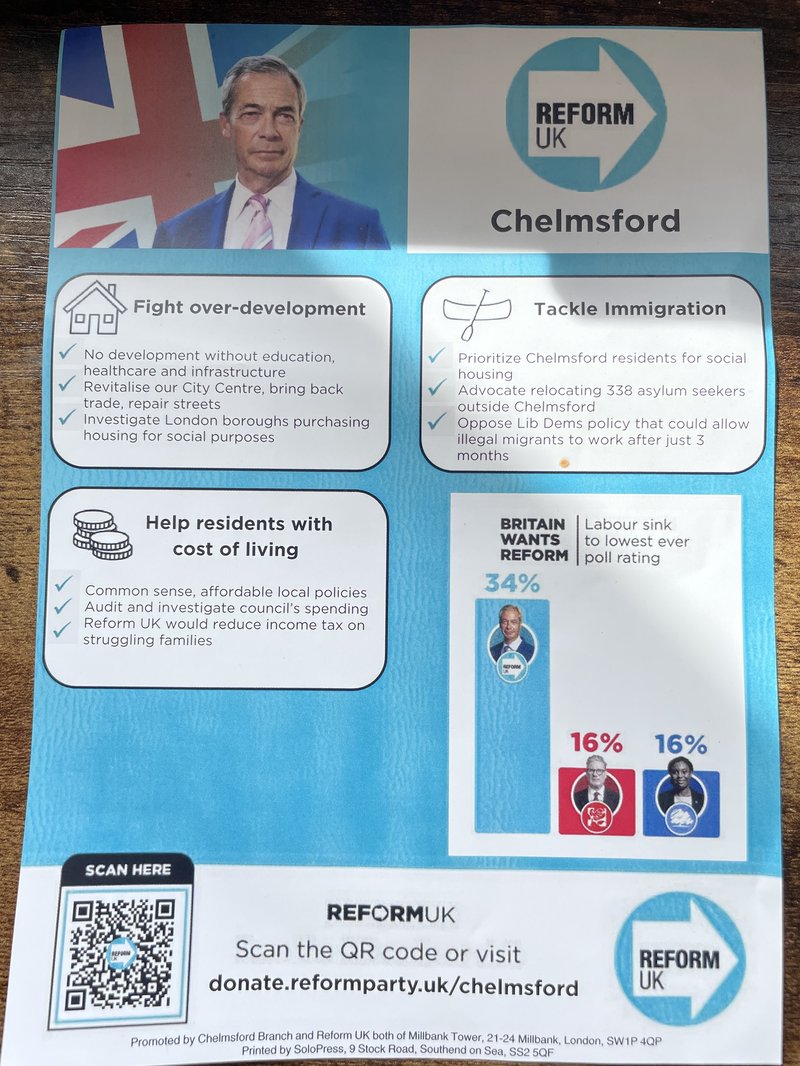
The out-of-proportion bars were one of the main problems with this Reform chart originally, and no amount of hindsight is going to fix that. However, they did win the most votes and seats in Chelmsford, where the Liberal Democrats—completely absent from the bar chart—finished second.
Liberal Democrat in Eastgate and Moreton Hall
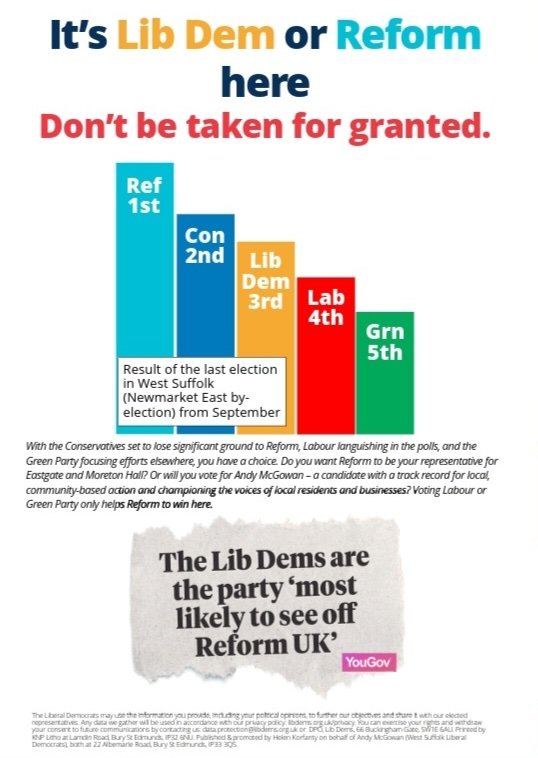
This was a chart that actually seemed to underestimate its party’s chances. As it turned out, the Liberal Democrat candidate finished second in Eastgate and Moreton Hall in Suffolk, where Reform did indeed end up winning.
Green Party in Cowley
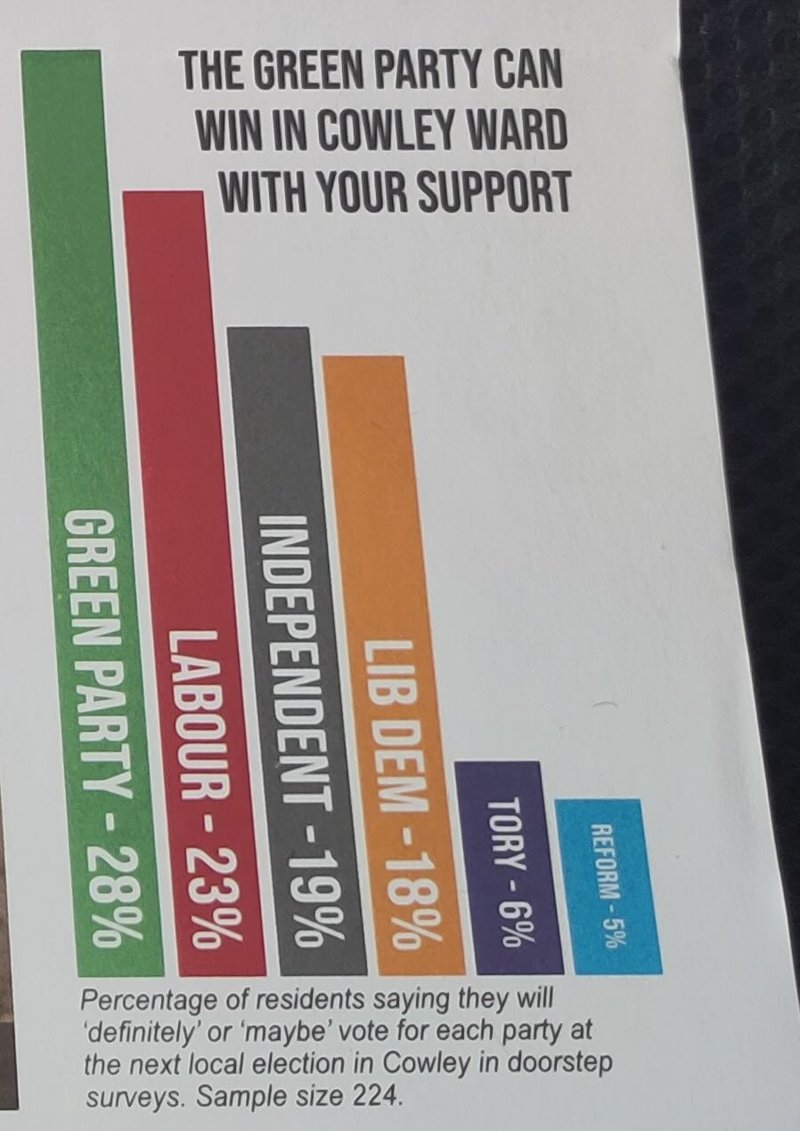
The Greens’ doorstep survey substantially understated their own support in Cowley, Oxford, where they actually won 46% of the votes on election day. In fact it wasn’t close to the final share for most of the candidates—even though it was clearly true that the Greens could win, because they did.