Employment: Is work being spread more thinly?
In this series of articles we try answer common questions about whether we can trust employment statistics, and go beyond the headline figures to assess the health of the labour market more comprehensively.
We’ve already looked at the question of whether the definition of employment is fiddled by the current government.
In this piece we look at the criticism that record employment has been achieved because work is being spread more thinly, and ask whether the employment rate would still be at a record high even if you changed the number of hours that count as being “employed”.
Join 73,000 newsletter subscribers who trust us to check the facts
Sign up to get weekly updates on politics, immigration, health and more.
Subscribe to weekly email newsletters from Full Fact for updates on politics, immigration, health and more. Our fact checks are free to read but not to produce, so you will also get occasional emails about fundraising and other ways you can help. You can unsubscribe at any time. For more information about how we use your data see our Privacy Policy.
People are working roughly the same number of hours
We’ve seen multiple instances of people expressing concern that employment figures hide the increase in zero-hours contracts, low-hours work and the number of part-time workers wanting more work.
The common thread in these arguments is that the increase in employment is actually down to work being spread more thinly, with more people working in low-hours jobs. But that doesn’t seem to be the case.
The average worker in the UK works 32 hours a week. That’s a fair bit lower (by around three hours per week) than in the early 1970s when records began. However over the past decade, as the number of people in employment has increased, the average hours worked per-worker has remained fairly flat.
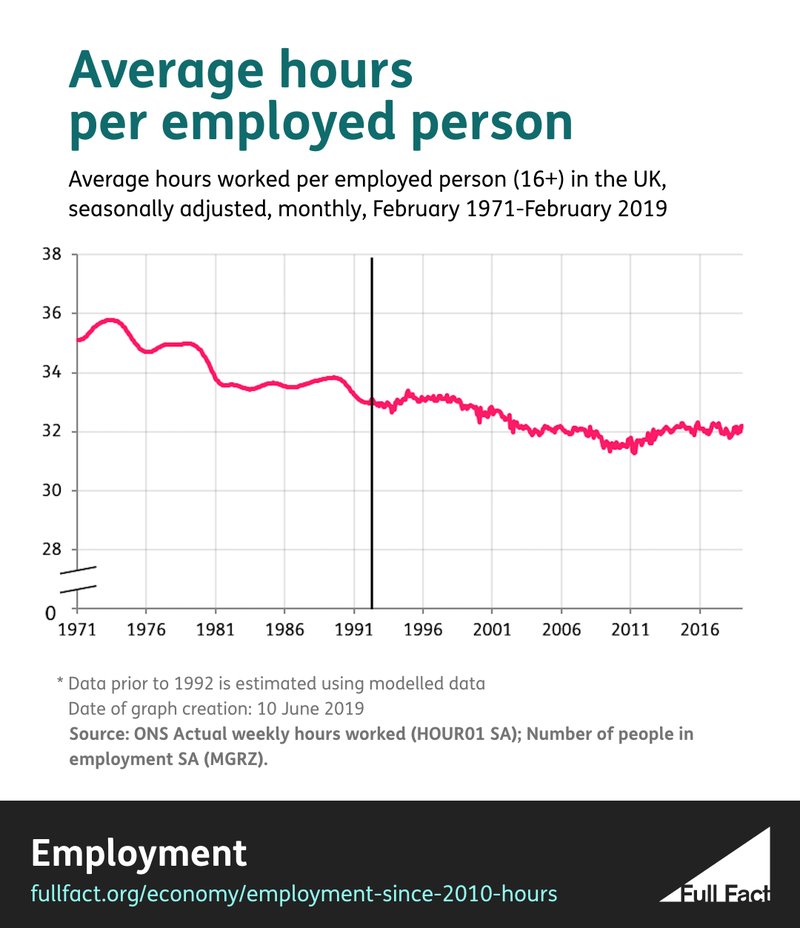
So the rise in employment over the past few years hasn’t come at the expense of people, overall, working fewer hours. Or to put it another way, work isn’t being spread more thinly.
Unemployment is at near-record lows, even if you define it in other ways
That average figure doesn’t entirely answer the criticism that, because you only have to work one hour a week to count as “employed”, the employment and unemployment rates could be misleading. Even if the average is flat, that could hide a change in the number of hours worked: there could be a lot more people working very few hours, and a few people working far longer hours.
Deciding where to draw the line between employment and unemployment is a matter of opinion, but that leaves the question as to what the unemployment rate would be if you did choose the define employment with a different hours threshold.
If you instead only counted people as employed if they did six hours of work a week, or 16 hours a week, the unemployment rate would still be at a record low (since 1992, which is as far back as data on hours worked is available for).
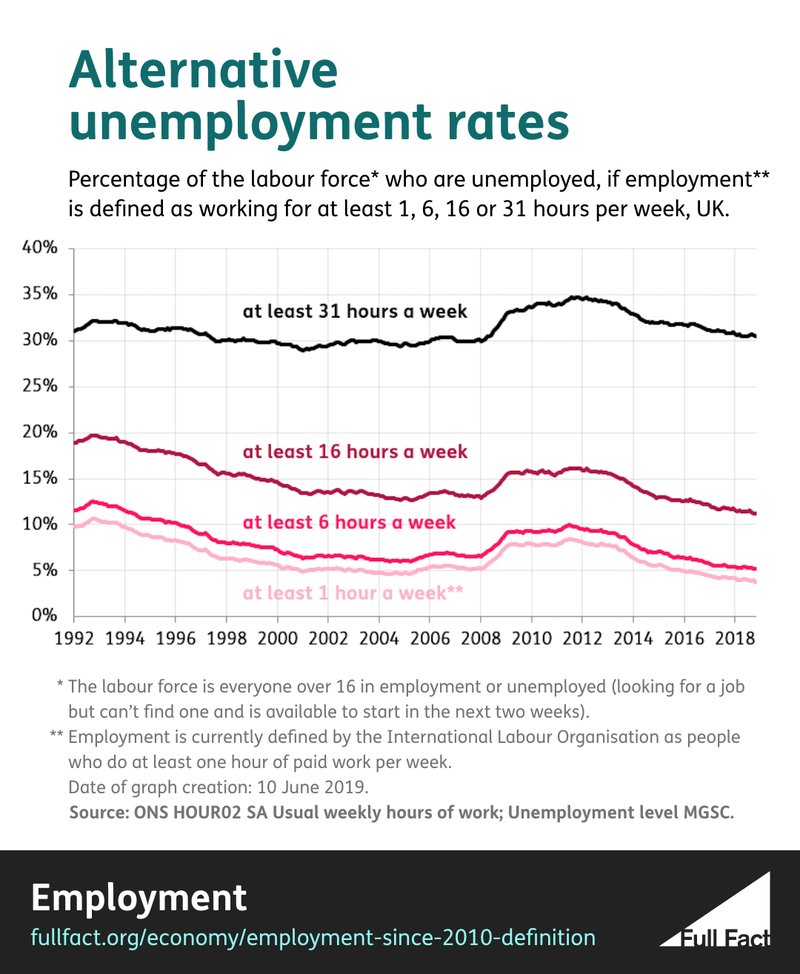
Only when you start to define employment as being over 30 hours of work a week do you find the unemployment rate isn’t at a record low. But it is still down since 2010 and at 30% is close to the record of 29% set in 2001.
So no matter what number of hours per week you think counts as being employed, changing the definition wouldn’t change the overall picture that much in terms of record employment and unemployment. Regardless of the hours threshold you set, unemployment is still at record or near-record lows.
The number of people wanting different hours is declining
As well as looking at the number of hours people are working, it’s also important to understand whether people are working the amount that they want.
There are many ways to look at how many people want different hours but we’ve taken the approach of looking at people who:
- Work fewer than 48 hours per week and want more hours (underemployed)
- Work but want fewer hours, and are willing to take a pay cut (overemployed)
The Office for National Statistics’ (ONS) definition of underemployed excludes people who want more hours but aren’t available to start working in the next two weeks. But we don’t see why these people should be ignored, as their lack of ability to quickly change jobs doesn’t change the fact that they are dissatisfied with their working hours, and so have included them in our definition of underemployed.
As for people who are overemployed, we’ve taken the same approach as the ONS, excluding people who say they want fewer hours for the same amount of pay.
Looking at these groups tells us more about how many people aren’t working the hours they want.
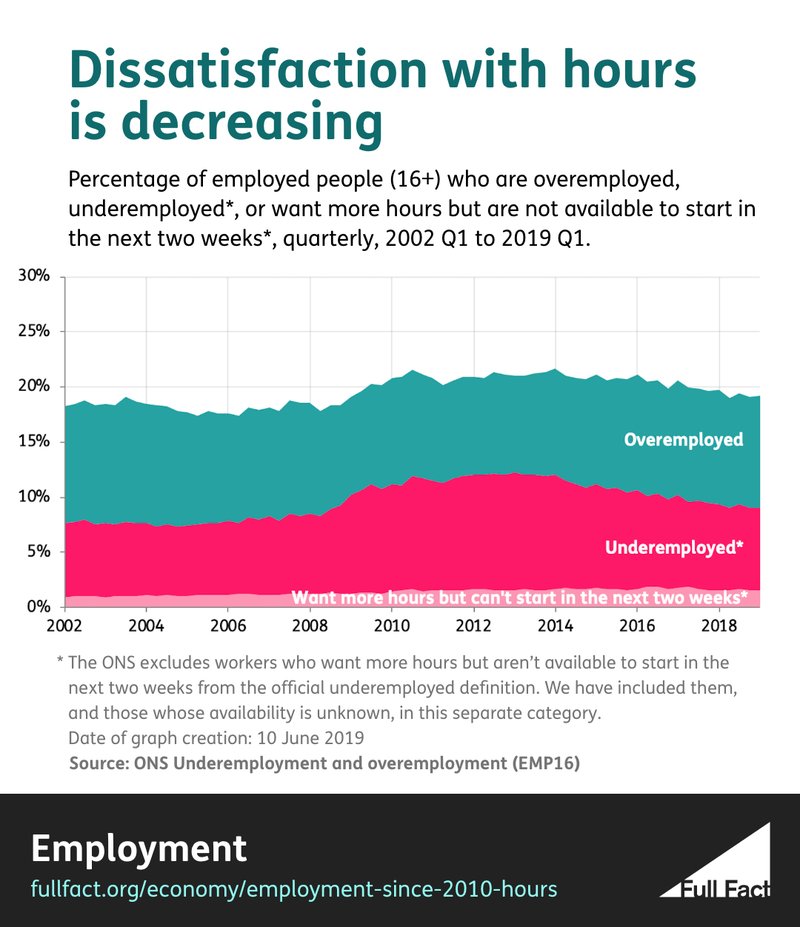
Currently 19% of workers are overemployed or underemployed by our definition. The level hovered around 18% from 2004 until the financial crisis, after which it increased to 22%. It’s been falling slowly since 2014.
As this level of dissatisfaction with hours has been decreasing in recent years, that suggests that most people who entered employment in recent years are in jobs that give them the amount of hours they want.
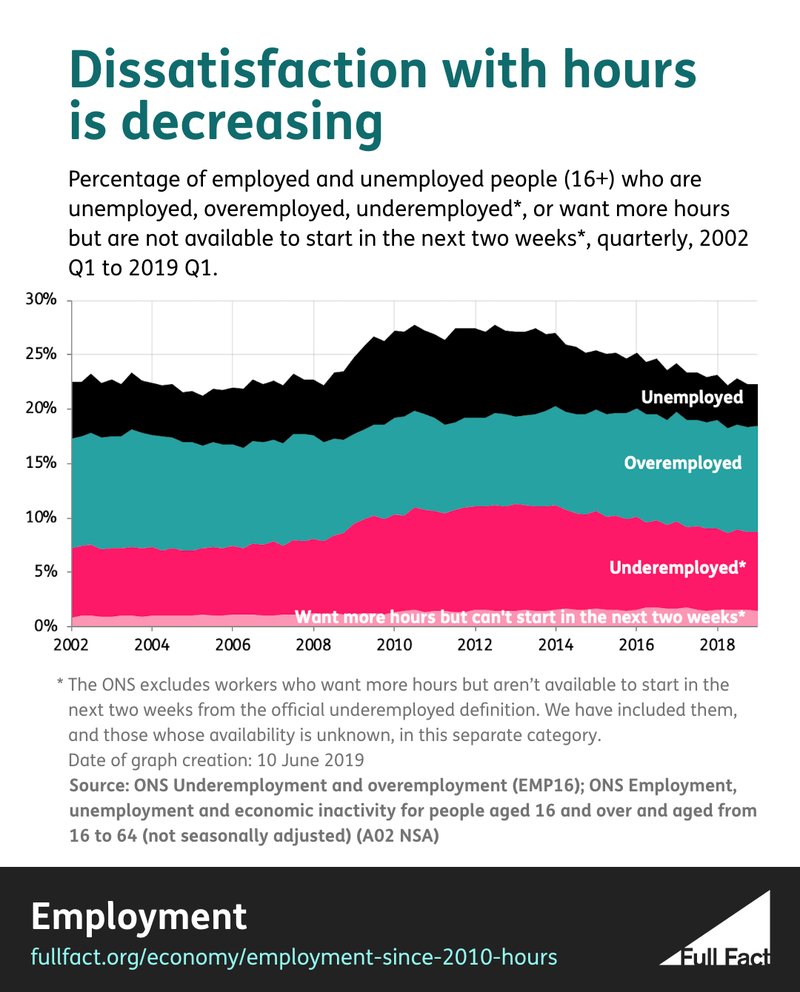
Another way to understand the scale of underemployment and overemployment is to include unemployed people in the calculations. Unemployed people—defined as out of work and actively seeking work—are, by their very nature, underemployed.
Including unemployed people in the calculation asks a slightly different question: what percentage of the whole available labour force (so people in work, and people who want to work) are getting the hours that they want?
This shows a similar picture. Looking at the whole of the available labour force, the proportion who are overemployed or underemployed is about 22% of the labour force.
The figure increased following the financial crisis and stayed around 27% between 2010 and 2013. Since then it has been decreasing and has now reached a level just above that seen in the half-decade before the financial crisis.
What does this all tell us?
In summary, since 2010 the proportion of the labour force in employment has increased, and so has the proportion of people satisfied with their working hours. At the same time the average number of hours worked per person has remained fairly flat. Record employment isn’t coming at the expense of more people working fewer hours, or hours they don’t want.
However, while the proportion of the labour force satisfied with their hours has been increasing, it’s not at record levels. A slightly higher proportion of the labour force (so, including unemployed people) are dissatisfied with their hours now than in the mid-2000s.
Also the statistics available don’t tell us the severity of underemployment and overemployment. Everyone underemployed or overemployed is grouped together whether they want to work one hour more or less a week, or 10 hours more or less a week.
So while the overall proportion of the labour force dissatisfied with their hours has decreased in recent years, it may be the case, for example, that the average underemployed person today wants far more extra hours than they did five years ago. But we just don’t know that from the statistics available.
They also don’t address the issue of zero hours contracts: in which, regardless of the number of hours actually worked, the worker isn’t guaranteed to work any hours. That’s what we’ll look at in the next article in the series.
More from this series:
- Why don't people trust employment statistics?
- Is employment up because the government is fiddling the statistics?
- Is employment up because work is being spread more thinly, with people working fewer hours?